-
 ChartAlert® 25.4.1FRI 18-Apr-2025All-in-one Desktop SoftwareLITE/RTE Edition AvailableComing — PRO Edition Advisory Charting Scanning End-of-Day DataReads 3rd Party Real-Time Data / MetaStock® format / MetaRefresher® modeNew!NSEBSEMCXNCDEXSelect Global User-Friendly Detailed Documentation Fully Customizable Multi-threaded and Fast Free Upgrades Friendly Support
 -
 ChartAlert® 25.4.1FRI 18-Apr-2025For Investors and TradersAll-in-one Desktop SoftwareLITE/RTE Edition Available
ChartAlert® — The ideal Real-Time and End-of-Day software for Charting and Scanning NSE/BSE stocks and equity indices, NSE futures and index options, NSE currency derivatives and MCX/NCDEX commodities — Includes advisories for the Indian stock market
Chart and Scan1 MetaStock2 format real-time or intraday data streaming from 3rd party RT data vendors during market trading hours in MetaRefresher2 mode
Know more
1Advanced Scanner can be used to manually scan 3rd party real-time data
1Renko/ P&F/ Harmonics/ Classical Chart Pattern Scans for RT data are coming in a future version
2Need not be installed on your computer
Discover all of ChartAlert's features, learn how to use them, watch slideshows or videos, explore our stock screeners, or read our blog at ChartAlert.in
Take me there now
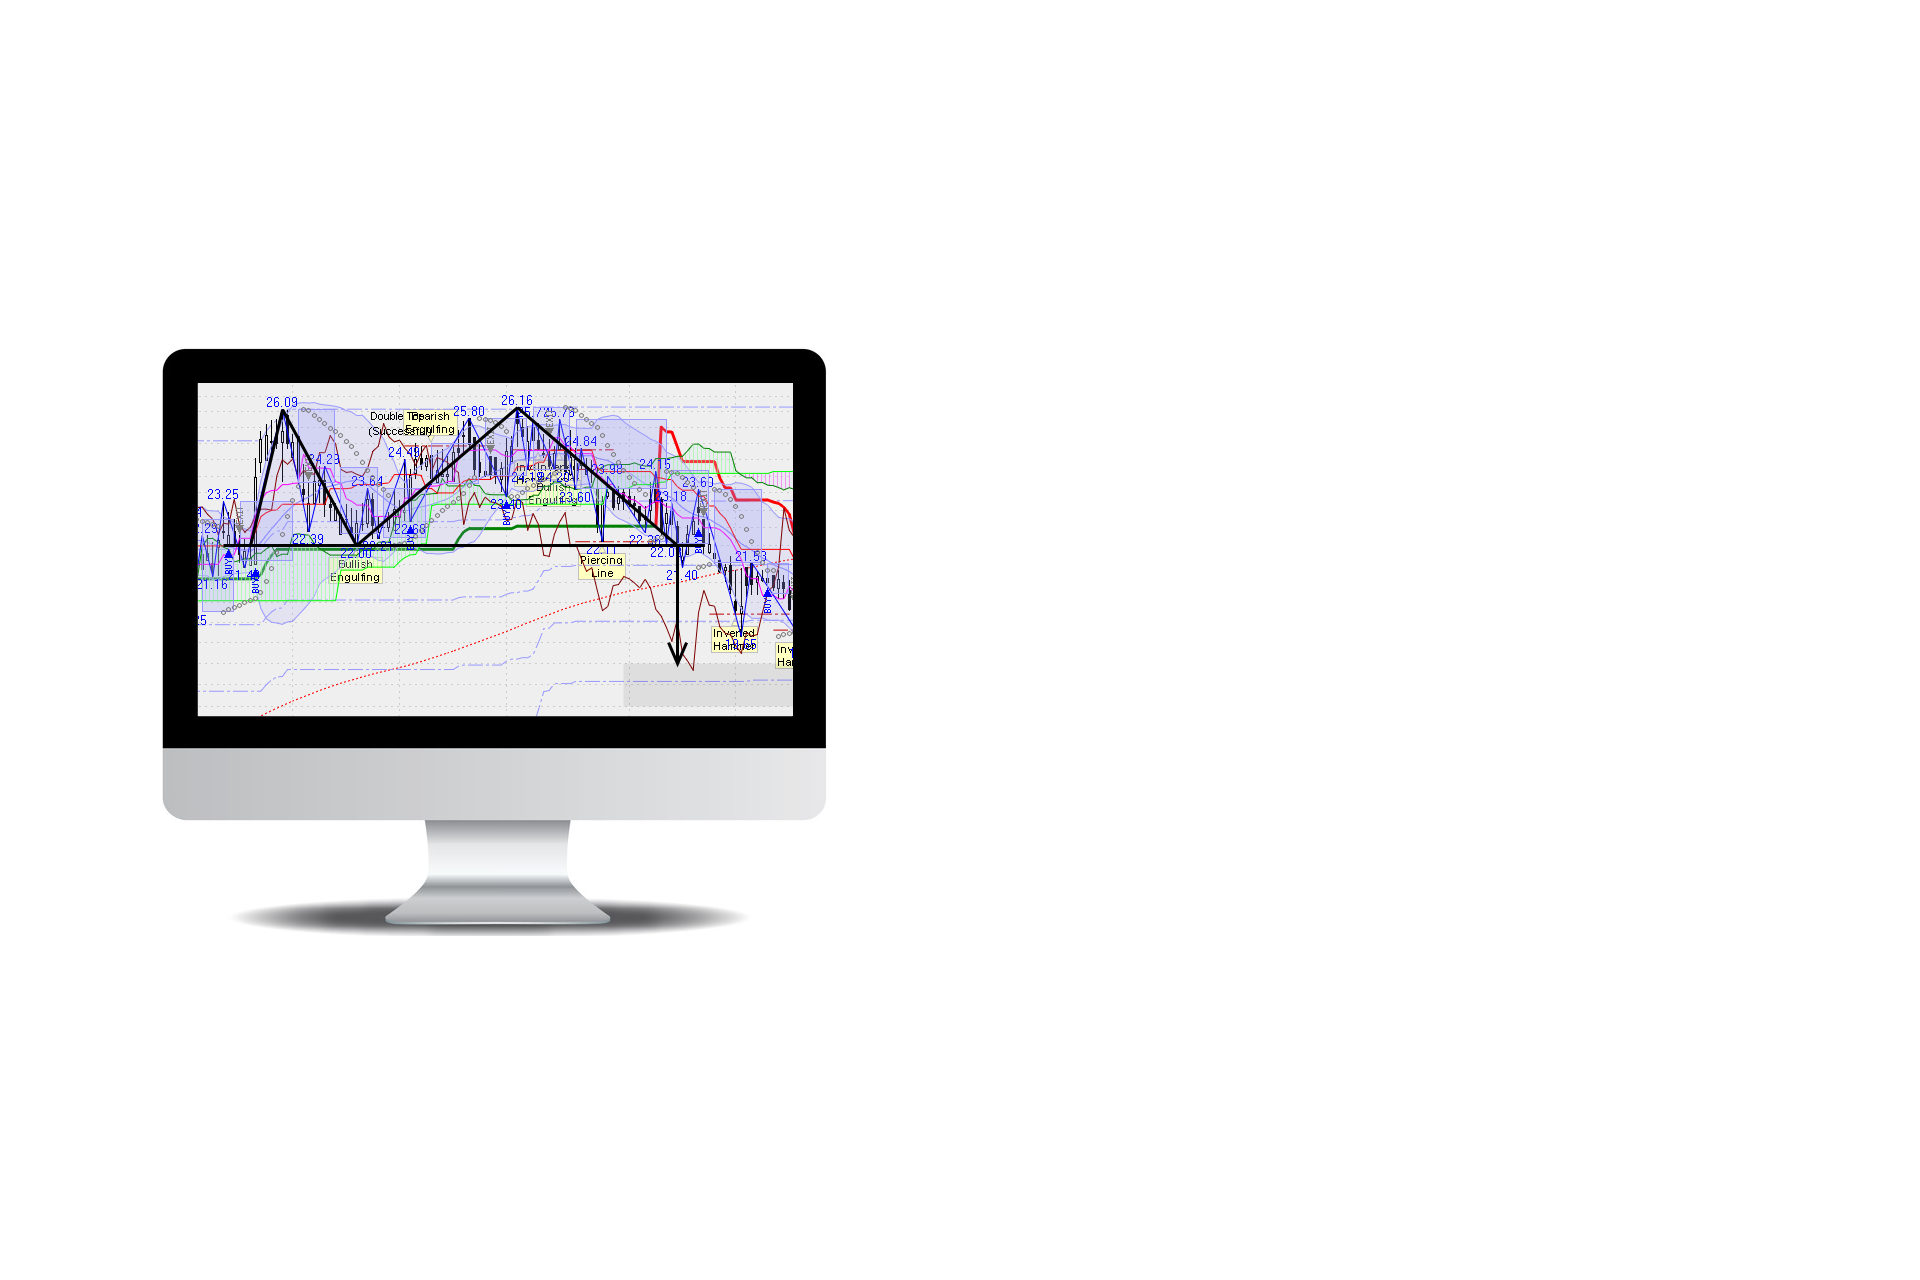
Technical Analysis
Charting
Drawing
Patterns
Harmonics
Masks
Relative Strength Charts or Ratio Charts — Symbol vs Symbol or Sector or Index – Sector vs Sector or Index – Index vs Index
Index Builder — Price-weighted Indices – Equal-weighted Indices
Moving Averages — Arnaud Legoux – Exponential – Hull – Kaufman's Adaptive – Simple – Weighted – Wilder – Zero Lag – and more
Technical Indicators — 150+ Indicators – Price Overlays – Oscillators
Customize, Zoom and Scroll interactive Charts in any time-frame viz. Intraday, Daily, Weekly, Monthly, Quarterly, Yearly, Multi-day
Fibonacci Studies — Fibonacci Retracement – Fibonacci Time Zones – Fibonacci Fan – Fibonacci Arc – Fibonacci Extension – Fibonacci Time Extension
Gann Studies — Gann Fan – Gann Grid – Gann Square – Gann-based Price Levels
Regression Studies — Linear Regression – Raff Regression – Quadrant Lines – Tirone Levels – Standard Error Channel – Standard Deviation Channel
Miscellaneous Studies — ABC Targets – Andrews' Pitchfork – Cycle Lines – Moon Phases – Schiff Lines – Speed Resistance Lines
Cup & Handle
Double Tops & Bottoms
Head & Shoulder
Rectangles
Triangles
Wedges or Diagonals
... and more
ABCD
ABCD Extn
Alt Bat
Butterfly
Deep Crab
Shark
Three Drives
27 Bullish Reversal Patterns including ... Engulfing Line – Hammer – Harami – Morning Star – Piercing Line – Three White Soldiers
27 Bearish Reversal Patterns including ... Dark Cloud Cover – Engulfing Line – Evening Star – Hanging Man – Harami – Shooting Star – Three Black Crows
7 Bullish Continuation Patterns including ... Rising Three Methods – Separating Lines – Upside Gap Three Methods – Upside Tasuki Gap
9 Bearish Continuation Patterns including ... Downside Gap Three Methods – Downside Tasuki Gap – Falling Three Methods – In Neck – On Neck – Separating Lines
Triple Tops & Bottoms
Spread ... Tops & Bottoms
P&F Triangles
Signals Reversed
Multi-Column Patterns
P&F Poles
Vertical Counts
... and more
Triple Tops & Bottoms
Head & Shoulder
Resistance-turned-to-Suppport
... and more
Short-term, Medium-term, Long-term Charting-based Strategies
Auto-plots the following ... Trendlines – Key Price Channels – Supports – Resistances
Automated Buy/Sell signals on the Chart, screened and ranked by ChartAlert®
Short-term and Medium-term Strategies, covering 33% of NSE Cash Stocks
Generates detailed Performace Metrics including ... Net Profit – Retention Rate – Success Rate – Drawdown – Return-on-Account – etc
Gann HiLo Activator – Gann Swing – Gann-based Price Levels – Stop Loss Indicators
Open multiple instances of a Chart with various studies applied
Monthly Trading Ranges — Plot crucial Supports / Resistances / Channel for the near-month F&O trading period
Relative Performance Charts — Compare upto 10 symbols from a particular point of time
Stop Loss Indicators — ATR-based – Moving Average-based – Percentage-based – Volatility-based
Synchronize time-scale or X-axis of multiple Charts for analysis
Volume – Deliveries – Price-by-Volume – Contracts – Open Interest – etc
Also includes ... AutoScroll Charts – Templates – Training Mode (simulates market conditions) – WatchLists – WorkSpaces
Basic Scanner
Advanced Scanner
Backtesting
Algos/Quants
Ships with tons of Factory Scans that can be copied, edited, modified, customized, saved and re-used to suit personal requirements
A common column builder tool that can efficiently scan and list repetitive data across all scan output reports
Scan and discover Bullish and Bearish signals across Index-constituents, Sector-constituents, WatchLists, or any set of Symbols
Combine multiple scans into a single Screener to save on time, and execute Screeners with 1-click on multiple sets of Symbols
Setup multiple scans in a Screener, and execute the Screener via a Sequencer, where the output of one Scan serves as an input to the next Scan
A Text Editor/Prompter that allows one to write algorithms in plain and simple English
Combine algorithms with filters, and multiple ANDing ORing conditions, to scan for Bullish and Bearish signals
Tons of Factory Scans are available to get started ... Copy, edit, modify, customize, save and re-use Scans
A common column builder tool that can be called from within a Scan to list repetitive data across all scan output reports
Combine multiple scans into a single Screener, or a Screener into a Sequencer, before executing on any set of Symbols
Ships with 900+ Functions including ... Price-Volume Functions – Market (Aggregate) Functions – Calculation Functions – Logical and Math Operator Functions
Also includes Functions for ... Indicators – Indicator Divergences – MAs – Candlesticks – Chart Patterns – Harmonics – P&F Patterns – Renko Patterns
And includes Functions for building ... P&F-based Relative Strength Matrices – P&F-based Trend Matrices – Trading Systems – etc
Write and backtest custom Algorithms on the basis of either the traditional OHLC data or the noiseless chart types (such as, say, Renko)
Backtest custom Trading Strategies to study the Performance Metrics of an eligible Symbol from its origin to the present day
Generates a portfolio summary report, as well as detailed statistics for each and every Symbol, and each and every simulated trade per Symbol
Stats include ... Winning/Losing Trades – Largest Win/Loss per Trade – Average Win-to-Loss – Profit Factor – Return Ratio – etc
Also includes other Stats like ... Gross Profit/Loss – Avg Win/Loss per Trade – Relative to Buy/Hold Index – Risk-Reward Index – etc
Export Backtesting report to a CSV file for an in-depth scrutiny of the detailed Statistics using an external 3rd party spreadsheet app
Also ships with Factory Trading Systems that generate short- and medium-term Bullish / Bearish signals for 33% of the NSE Cash Universe
Scan for popular Harmonic Patterns — 5-0 – ABCD – ABCD Extension – Bat – Alt Bat – Butterfly – Crab – Deep Crab – Gartley – Shark – Three Drives
Scan for 50+ Bullish and Bearish Reversal and 15+ Bullish and Bearish Continuation Candlestick Patterns
Pattern Detection enabled for all time-frames ... Daily, Weekly, Monthly, Quarterly, Yearly, Multi-day
Scan across any set of Symbols based on 150+ Technical Indicator algorithms
Scan across any or all Symbols by combining "n" set of algorithms filtered by "n" set of conditions
Also scan for divergences between Price and Oscillators including ... CCI – EWO – MACD – MFI – OBV – RSI – Stochastics – W%R – custom oscillator
Scan for P&F Patterns — Double/Triple Tops/Bottoms – Catapults – Triangles – Traps – Poles – Long Tail Reversals – Vertical Counts – etc
Scan for Renko Patterns — Double/Triple Tops/Bottoms – Triangles – H&S – Supports – Resistances – Resistance-is-Suppport – Support-is-Resistance – etc
Scan for P&F Relative Strength Matrix — "Arm-wrestling" between Symbols, Sectors and Indices to determine the stronger Symbol within a Sector/Index
Scan for P&F Trend Matrix — Multiple iterations of P&F Parameters to evaluate the strength of a trend in a given Symbol
Combine scans based on Technical Analysis and Fundamental Analysis parameters
Set Alerts using CASL/Advanced Scanner
Write custom Technical Indicators using CASL/Advanced Scanner
Stock Market Advisories
Information & Prospecting Reports
Positional and Swing Strategies for Short-term, Medium-term and Long-term time-frames
Real-time Snapshot Reports at 11:15AM and 2:15PM for approx. 500 NSE symbols
1-Stock / Multi-Stock Snapshot Reports — View-by-Company and MyRoutine
Expected Daily, Weekly and Monthly Trading Ranges
Short-term and Medium-term Model Portfolios constituting 50 symbols each
Sectoral Outlook
Buzzing Stocks
Trending Stocks
Unusual Performers
Institutional Trends FIIs/DIIs/MFs
Substantial Acquisition & Insider Trading Reports
Gainers and Losers
Price Data
Delivery Statistics
Index Composition Reports
Stocks-by-Sector Reports
Fully Customizable Reports with Advanced Sorting and Advanced Filtering
Fundamental Forecasts and Valuations for upto 500 NSE-listed Companies — Phase-2
ElliottWave Advisory for upto 50 Companies
Data
End-of-Day
3rd Party Real-time
NSE/BSE
MCX/NCDEX
Select Global
NSE End-of-Day ... Cash Market – Equity Indices – Futures – Index Options – Currency Derivatives
BSE End-of-Day ... Cash Market – Equity Indices
MCX and NCDEX End-of-Day ... Commodities
Global End-of-Day ... Equity Indices – Commodity Futures – Forex – Baltic Freight Index
Manually scan 3rd Party Real-Time Data using CASL in the Advanced Scanner
Set Alerts or Auto-Scan 3rd Party Real-Time Data streaming in MetaStock® format / MetaRefresher® mode or via 3rd Party API-based Plugins
User-Friendly Interface
Provides easy access to features; makes it simple to find tools and options; is intuitive and needs little instruction; is dependable, and does not malfunction.
Detailed Documentation
Help files cover topics in great detail; include learning-focused reference material, how-to manuals, and comprehensive documentation on CASL capabilities.
Free Upgrades
Software updates that provide improvements and new features are always free! Includes access to updated versions even during a trial period of four weeks.
Fully Customizable
Collaboration-based customization gave rise to design; all features, reports, charts, and scans can be tailored to meet personal specific needs.
Multi-threaded and Fast
Full threading is available in ChartAlert®. The process enables lightning-fast data updating and scanning. Is prepared for RT charting and scanning in the future.
Friendly Support
If you ever run into trouble, let us know. We react to emails within a day. If your request is complicated, we will do our best to find a solution within 48 hours.
Computer / System Requirements
Computer Configuration — Minimum and Recommended
- Microsoft® Windows® 7 Home Premium or Professional with SP1 Recommended OS: Microsoft® Windows® 10
- Microsoft® .NET Framework 4.5.1
- Intel® Core™ i3 3GHz+ CPU Recommended CPU: Intel® Core™ i5 Quad-Core 3GHz+
- 8GB of RAM Recommended RAM: 8GB
- 1.5GB of free hard disk space (for technical analysis charting data, stock market advisory archives, scanning reports)
- 1024 x 768 screen resolution Recommended Screen Resolution: 1366 x 768 (or) 1920 x 1080
- Mouse (or equivalent pointing device)
- Internet connection for downloading data, upgrading software, etc.
.NET Framework and Windows® Operating System
.NET Framework Ver4.5.1 — essential for ChartAlert® — is supported in the following operating systems only:- Windows® 7
- Windows® 8.x
- Windows® 10 *
- Windows® 11 *
Microsoft® has suspended support to all other operating systems. If your OS is not in the list above, then .NET Framework Ver4.5.1 will not get installed on your computer.
* The .NET Framework comes in-built with Windows® 10 and 11. Downloading and installing .NET Framework on a Windows® 10 and 11 computer is not required.
Intel® based Apple® Computers — Parallels Desktop, VirtualBox, etc.
ChartAlert® is a Microsoft® Windows® compatible Real-Time-Enabled and End-of-Day Technical Analysis Advisory, Charting, and Scanning software. It has been designed based on Microsoft® technology, and requires the installation of .NET Framework 4.5.1 to run on your computer.
ChartAlert® has been tested successfully on various Windows platforms, including Windows® 7, Windows® 8.x, Windows® 10, and Windows® 11, across both 32-bit and 64-bit AMD® and Intel® computers.
We have not tested ChartAlert® on Apple® computers with Windows® running natively on Parallels Desktop, VirtualBox, etc.
We have not tested ChartAlert® on Apple® computers running on "M" processors.
If you're an Apple® computer user, then please be informed that ChartAlert® may or may not run on your Apple® computer. We request that you don't opt for an Evaluation Trial or a Subscription Plan if you're planning to use ChartAlert® on an Apple® computer. We regret that we're presently unable to provide any kind of technological support to help setup ChartAlert® on an Apple® computer running Parallels Desktop, VirtualBox, etc.
Intel® based Apple® Computers — Windows® Operating System via Boot Camp
ChartAlert® has been tested successfully on the older generation Intel® based Apple® computers with Windows® OS running via Boot Camp.
Please ensure that Windows® and .NET Framework 4.5.1 have been installed on the Windows® side of your Apple® computer via Boot Camp before you install ChartAlert® along with its Historical DataSets.
We are happy to inform you that we're presently able to provide technological support to help setup ChartAlert® successfully on an Apple® computer based on an Intel® processor with Windows® Operating System running via Boot Camp.
P.S. We have not tested ChartAlert® installed via Boot Camp on Apple® computers running on "M" processors.