| ChartAlert® Features / Editions | LITE Edition | RTE Edition | PRO Edition |
|---|---|---|---|
| Buy Now! | RTE and PRO Editions coming in 2015 |
||
| Basic Advisory Content | | | |
| Premium Advisory Content — Coming! | | ||
| Charting | | | |
| Basic Scanner | | | |
| Advanced Scanner | | | |
| Market Prospecting Reports | | | |
| End-of-Day Data | | | |
| Read/ Chart/ Scan 3rd Party Real-Time Data — Coming! | | | |
| Fundamental Reports/ Spreadsheet — Coming! | | ||
| Futures & Options Module — Coming! | | ||
| Currently available on a complimentary basis | |||
ChartAlert® Features and Editions
Basic Advisory Content — Included with LITE Edition
Basic Advisory Content will also be included with RTE and PRO Editions in 2015
Basic Advisory Content includes: Advisories for Full-time & Part-time Traders — Real-time Snapshot Reports at 11:15AM & 2:15PM — DayTrading, Short-term, Medium-term & Long-term Strategies — Position & Swing Trading Strategies — 1-Stock Snapshot Report — Multi-Stock Snapshot Report — Daily, Weekly & Monthly Trading Ranges.
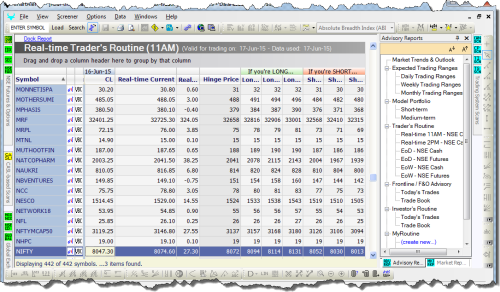
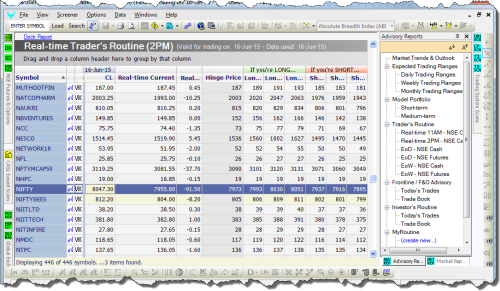
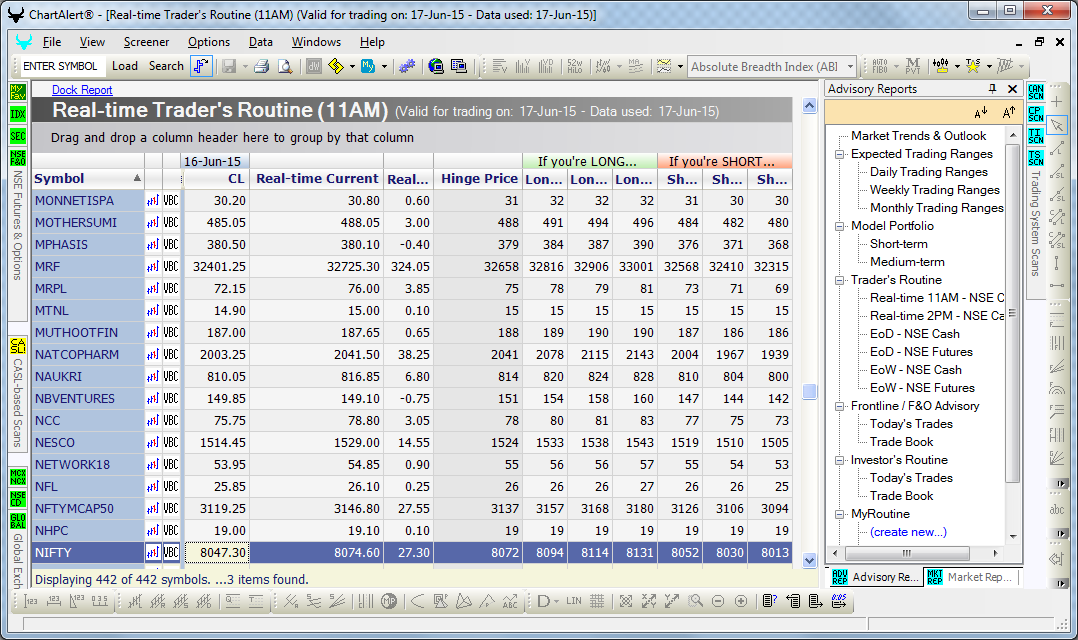
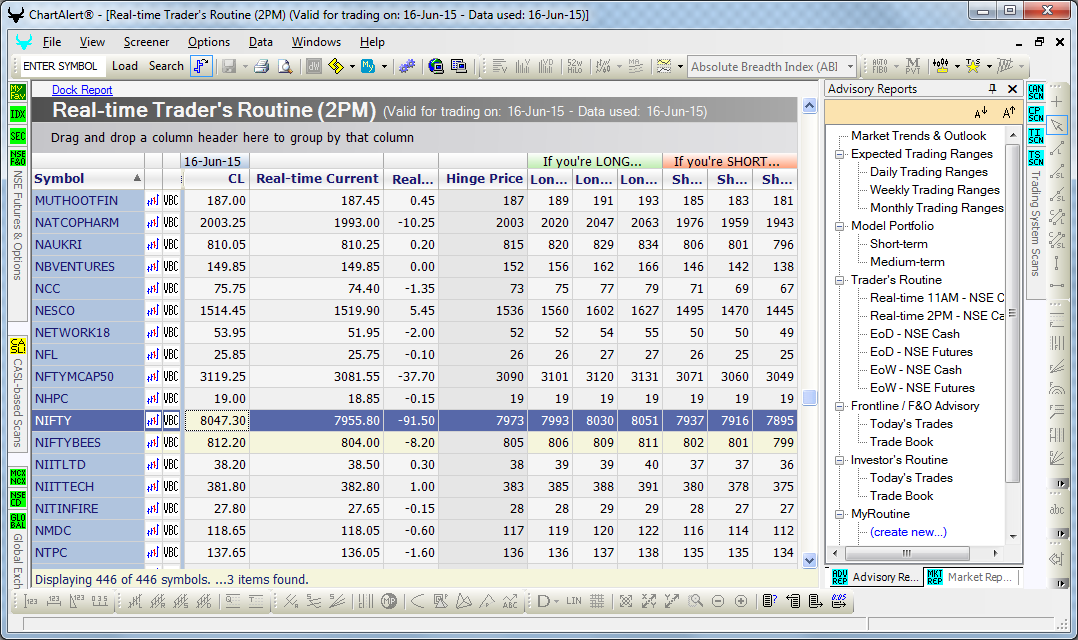
- RTTR is a daytrading stock advisory report for full-time traders
- It is based on the modified classic pivot strategy
- It covers over 400 leading NSE cash stocks during market trading hours
- It is issued twice during trading hours at 11:15AM and 2:15PM:
- The 11:15AM report evaluates the OHLCV data of the early morning session and issues crucial price triggers and resistances/ supports for trading up to 2:15PM
- The 2:15PM report issues updates for trading up to the end of the day
- It can be customized by adding/ deleting several technical parameters, and can also be sorted and filtered on those parameters
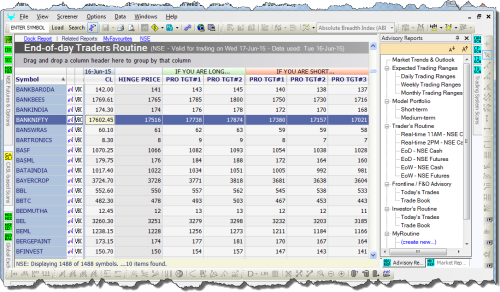
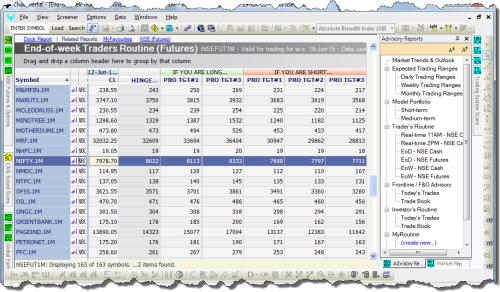
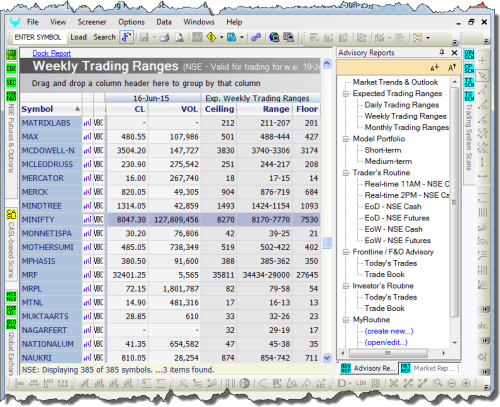
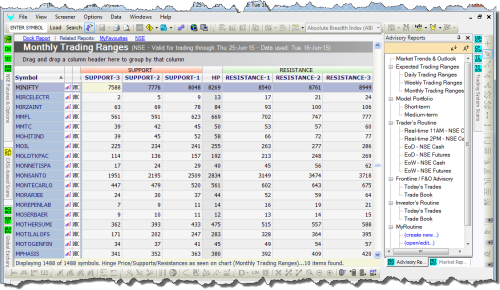
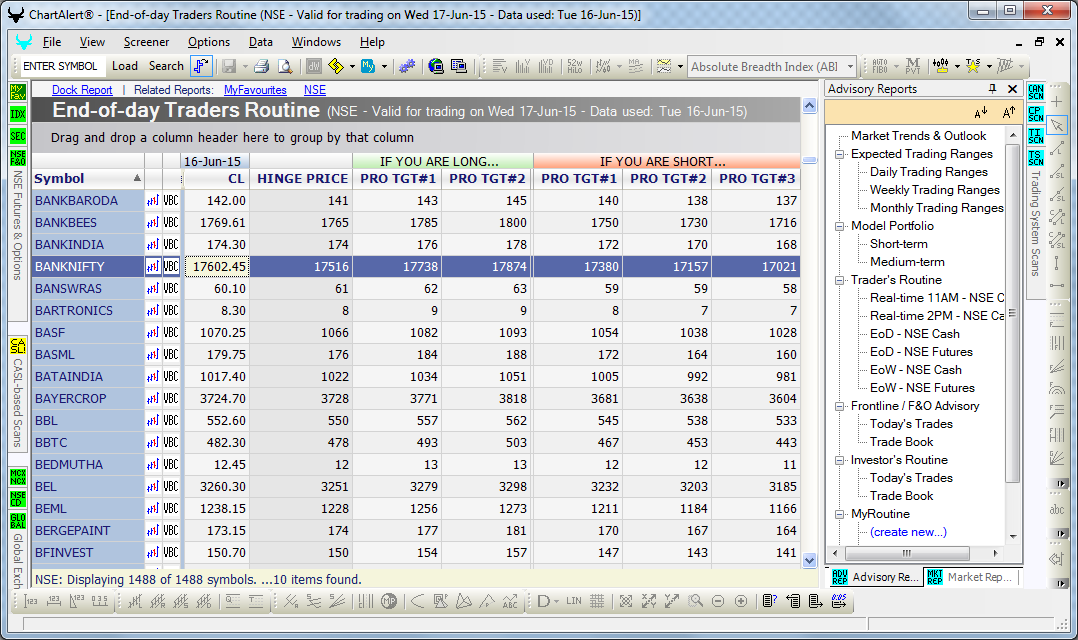
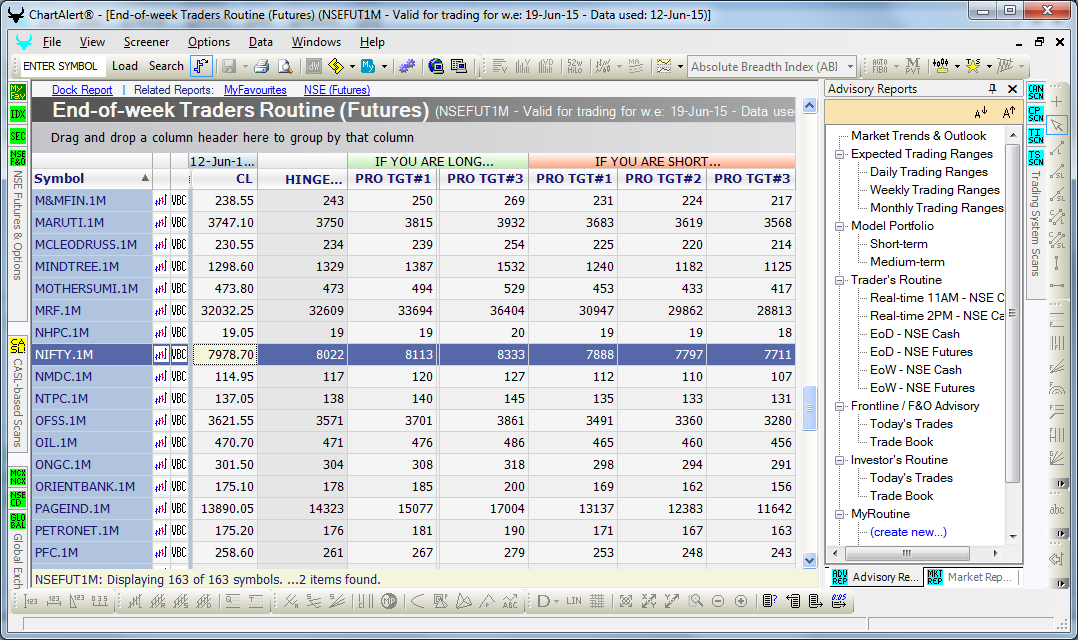
- TR reports are stocks & futures advisory reports for full-time traders — they list crucial price triggers, and resistances & supports
- They are based on the modified classic pivot strategy
- All TR reports cover over 1500 leading NSE cash stocks, and all NSE futures
- The Daily TR report — issued after market trading hours — is valid for trading the next day
- The Weekly TR report — issued after market trading hours on Fridays — is valid for the upcoming trading week
- The Monthly TR report — issued after market trading hours on the last Thursday of the month, coinciding with the F&O settlement — is valid for the upcoming F&O trading month
- Use the Daily, Weekly and Monthly TR reports in conjunction with each other to understand where a symbol may be in the overall trading range — this renders taking an intraday or intraweek or intramonth position in that symbol all the more easy
- All TR reports can be customized by adding/ deleting several technical parameters, and can also be sorted and filtered on those parameters
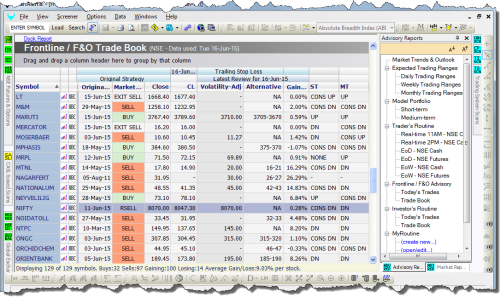
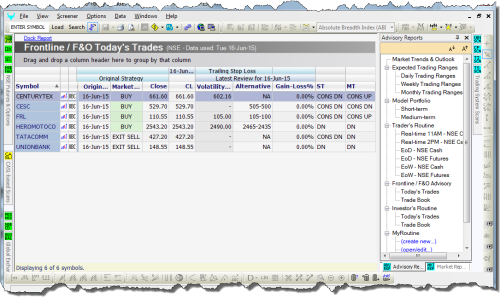
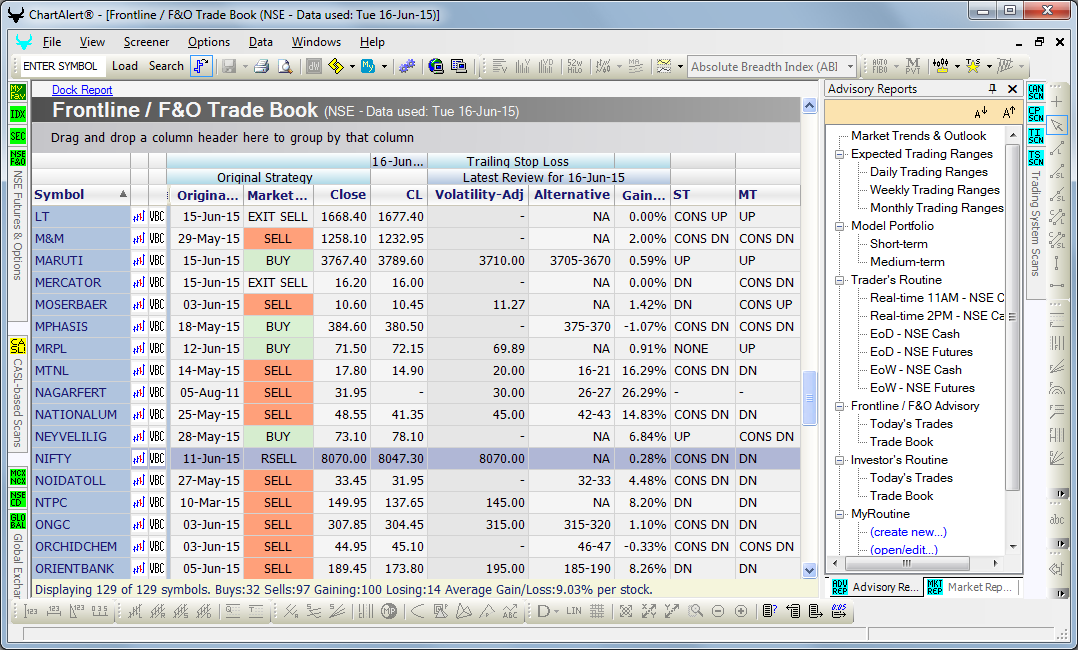
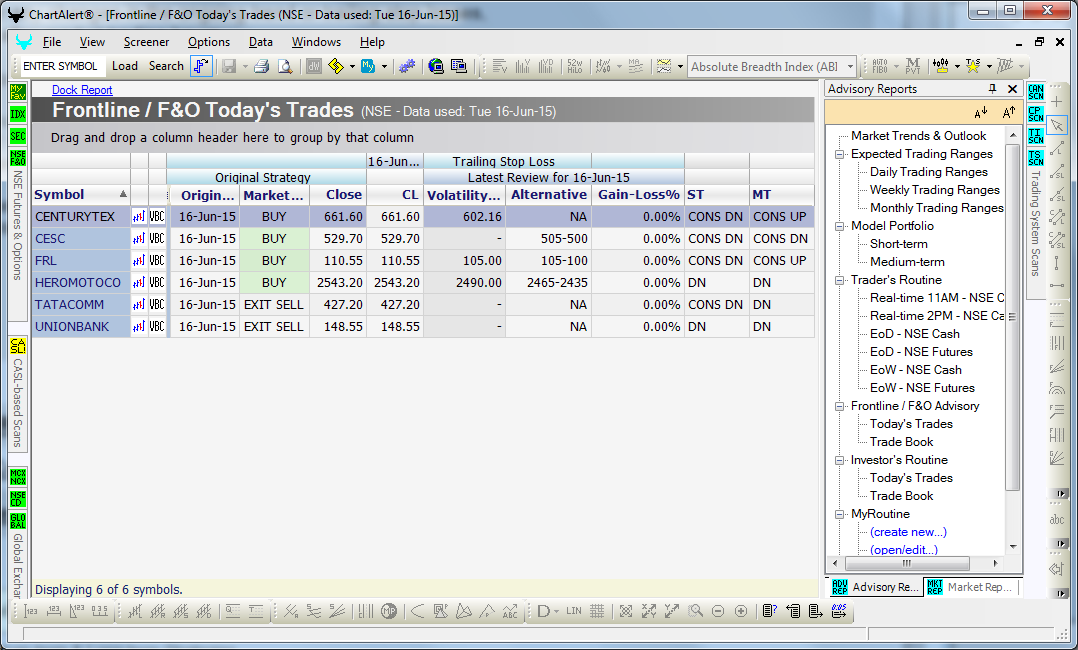
- FFO is a short- to medium-term stock market advisory and/or forecast report for full-time traders and part-time traders, and for those who can take above-average risk
- It uses a trend-following strategy — positional trading — that seeks to exploit cyclical trends that last anywhere between a few days and several weeks
- It covers 120+ of Sensex-component and/or Nifty-component stocks, and the F&O list of symbols
- Trading positions can be established in the cash and/or derivatives market for as long as the trend is expected to continue
- Symbols are monitored everyday for any changes in the ongoing trend or trailing stop losses, and the report is updated everyday after market trading hours
- It publishes the following trading information:
- Date when the Trend (Buy, rBuy, Sell, rSell) was established
- Explicit Entry (Buy, rBuy, Sell, rSell) levels
- Trailing Stop Loss levels that are updated End-of-Day
- It can be customized by adding/ deleting several technical parameters, and can also be sorted and filtered on those parameters
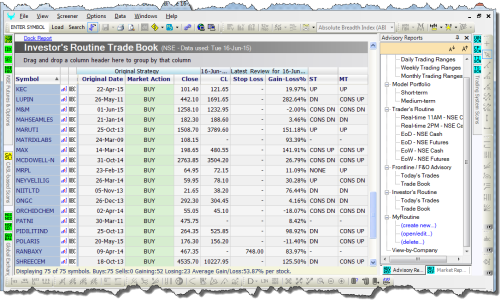
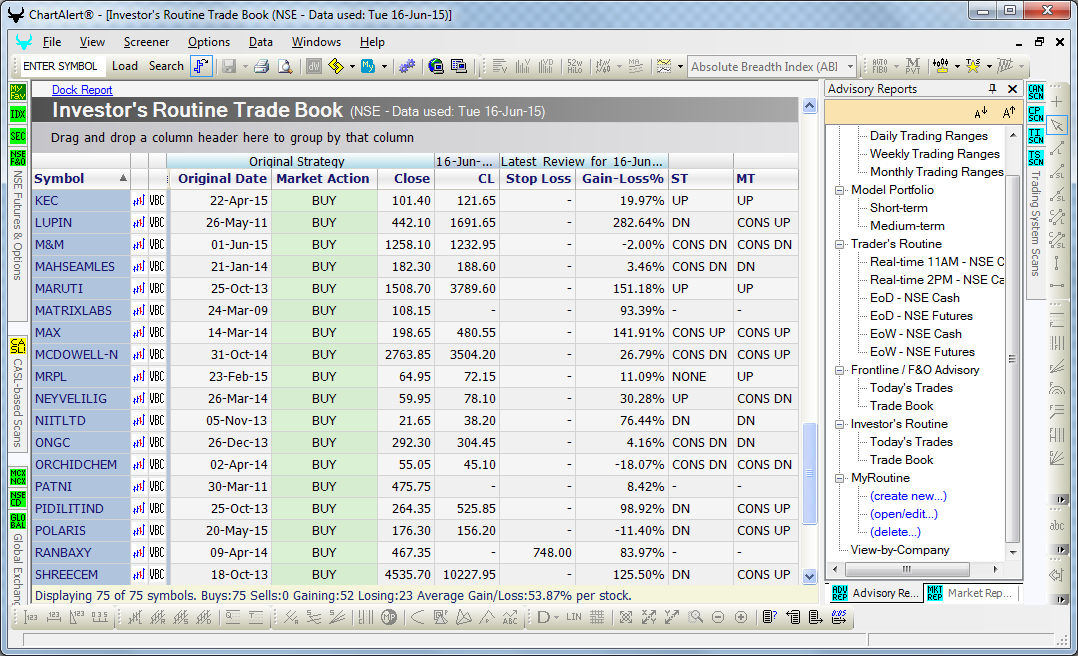
- IR is a short- to medium-term stock market advisory and/or forecast report for full-time and part-time traders, and for those who can take above-average risk
- It uses a trend-following strategy — positional trading — that seeks to exploit cyclical trends that last anywhere between a few days and several weeks
- It monitors top traded large-, mid- and small-cap stocks, several of which constitute the mid-cap and small-cap sectoral indices
- Trading positions can be established in the cash and/or derivatives market for as long as the trend is expected to continue
- Symbols are monitored everyday for any changes in the ongoing trend or trailing stop losses, and the report is updated everyday after market trading hours
- It publishes the following trading information:
- Date when the Trend (Buy, Sell) was established
- Explicit Entry (Buy, Sell) levels
- Trailing Stop Loss levels that are updated End-of-Day
- It can be customized by adding/ deleting several technical parameters, and can also be sorted and filtered on those parameters
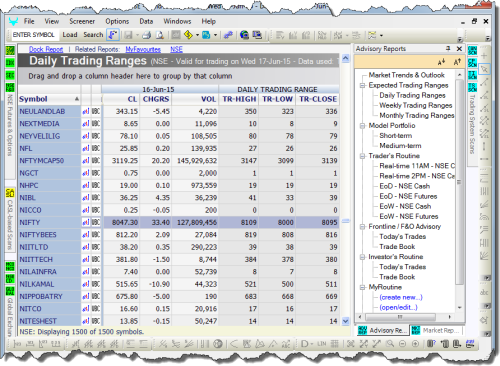
- A short-term advisory feature that publishes expected daily, weekly and monthly Trading Ranges that includes the following:
- Probable High, Low and Close for the next trading day
- Probable Ceiling, High-Low Trading Range and Floor for the next trading week
- Probable Supports, Resistances and crucial Hinge Price for the ongoing 1-mo futures contracts
- This feature can also be plotted visually as a chart overlay
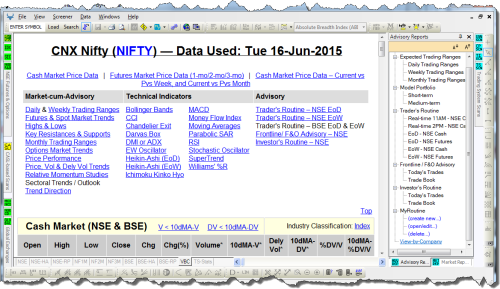
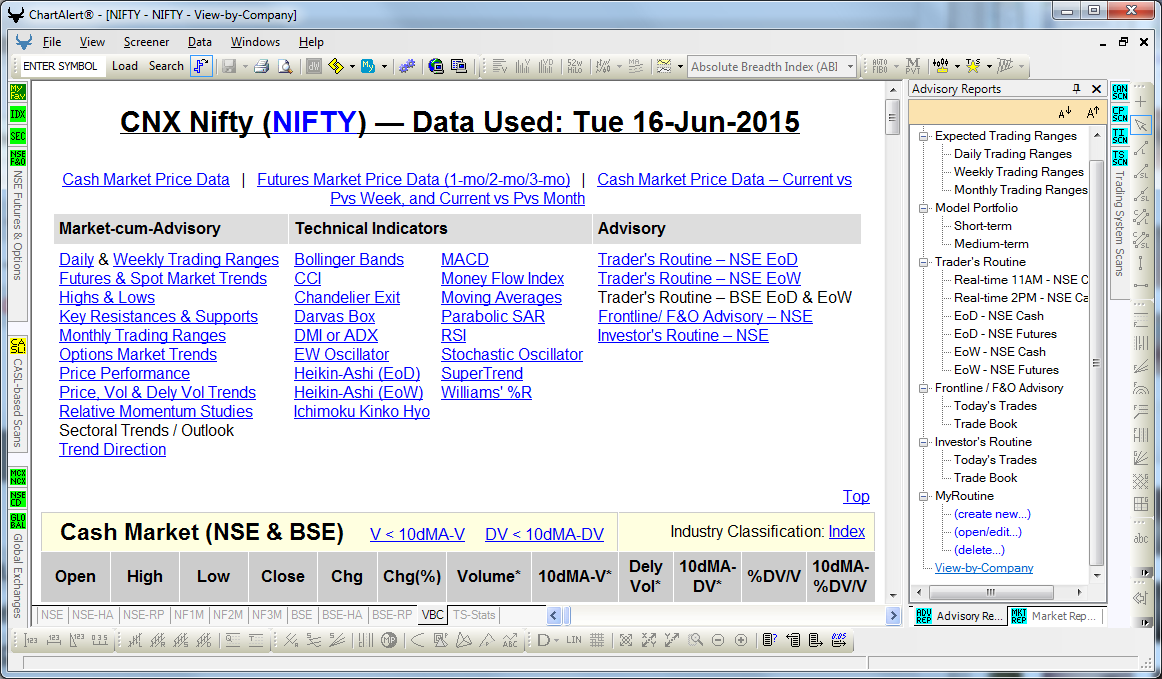
- A one-stop feature where the Price-Volume data and the Technical Analysis of an individual symbol are assembled together in an easy-to-pull-and-print format
- VBC is simply a snapshot of an individual symbol
- The report includes the following:
- O-H-L-C-V information from NSE/BSE — Cash, Futures and/or Index Options
- Current week vs previous week, and current month vs previous month, cash market performance
- Short-, medium- and long-term Trend direction and Relative Momentum Study
- Key Resistances and Supports
- Daily, Weekly and Monthly Trading Ranges
- Weekly, Monthly and Quarterly Sectoral Outlook and/or Trend
- Cash, Futures and Options Market Trend
- 5-day Price, Volume and Delivery Volume Trend
- 1-day, 5-days, 10-days, 1-mo, 2-mo, 3-mo, 6-mo, 12-mo and 24-mo Price Performance
- 3-mo, 6-mo and 52-week Highs and Lows; recent Swing Highs and Lows
- Technical Indicators: Bollinger Bands, CCI, Chandelier Exit, Darvas Box Breakout, DMI/ADX, ElliottWave Oscillator, Daily & Weekly Heikin-Ashi, Ichimoku Kinko Hyo, MACD, Money Flow Index, Parabolic SAR, RSI, Stochastic, SuperTrend, Williams' %R; Simple and Exponential Moving Averages
- Advisory Reports: Trader's Routine, Frontline/ F&O Advisory, Investor's Routine
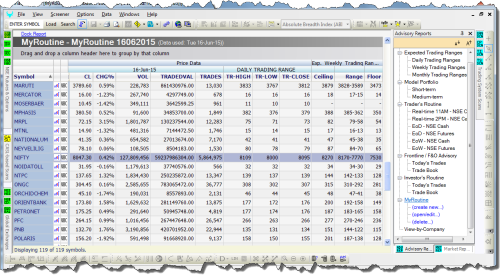
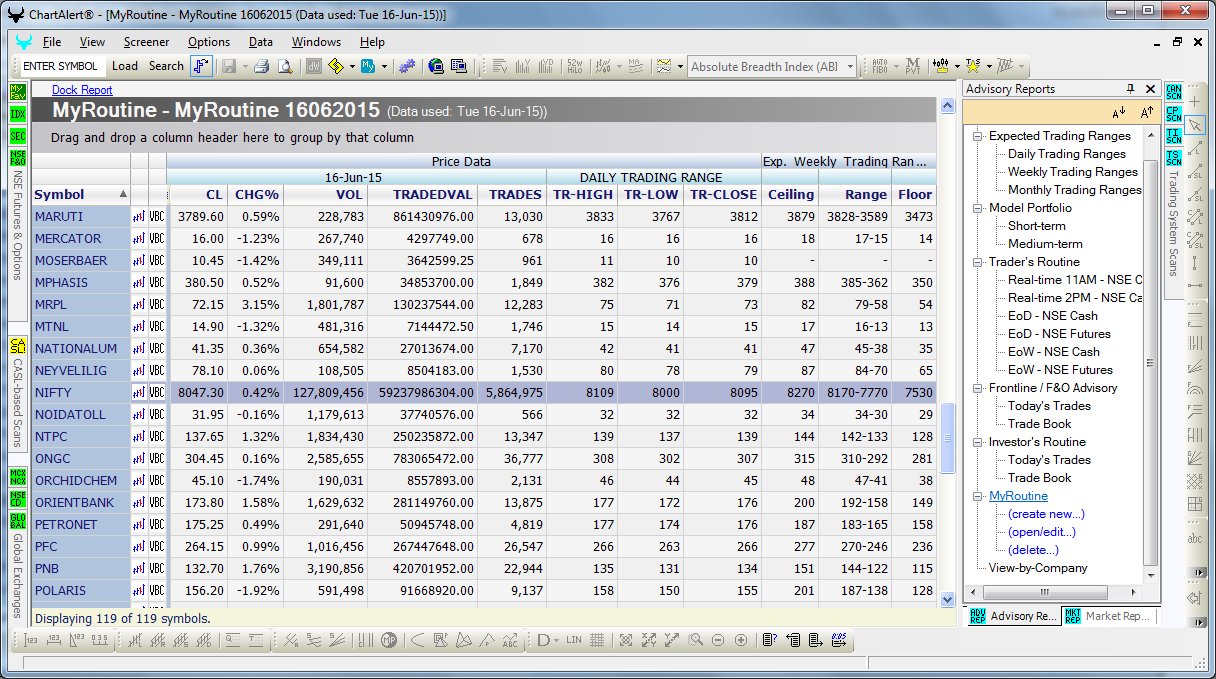
- A one-stop feature where the Price-Volume data and the Technical Analysis of multiple symbols are assembled together in an easy-to-pull-and-print format
- MyRoutine is simply a snapshot of multiple symbols across all time-frames
- The report includes the following:
- O-H-L-C-V information from NSE/BSE — Cash, Futures and/or Index Options
- Short-, medium- and long-term Trend direction
- Key Resistances and Supports
- Daily, Weekly and Monthly Trading Ranges
- 52-week Highs and Lows
- Select Simple and Exponential Moving Averages
- Advisory Reports: Trader's Routine, Frontline/ F&O Advisory, Investor's Routine
Charting Features — Included with LITE Edition
Charting Features will also be included with RTE and PRO Editions in 2015
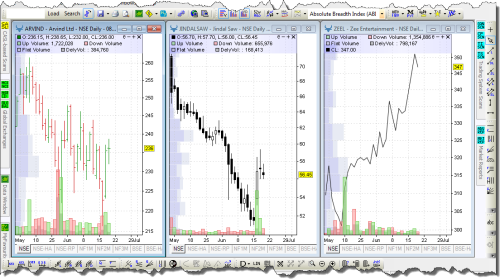
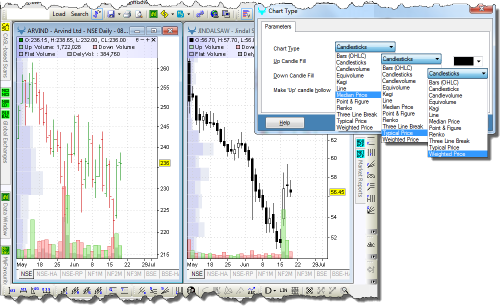
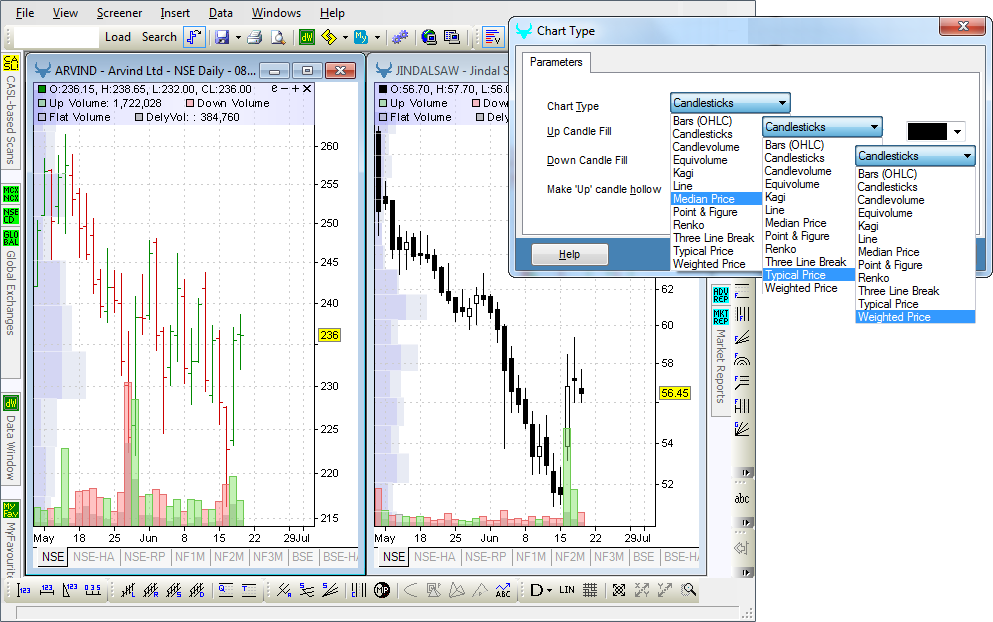
- ChartAlert® includes the following basic chart types ...
- While the Bar / Candlestick charts use O-H-L-C data, the Line chart uses only the closing prices, and although the Median, Typical and Weighted Price charts look like the Line chart, the plot itself uses all of the O-H-L-C data
| OHLC Bar | Japanese Candlestick | Line | Median Price | Typical Price | Weighted Price |
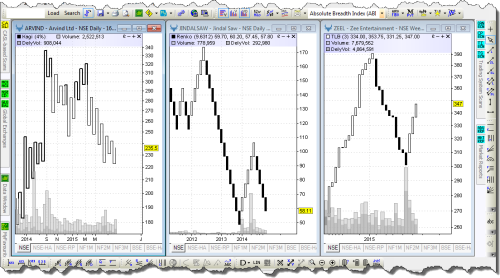
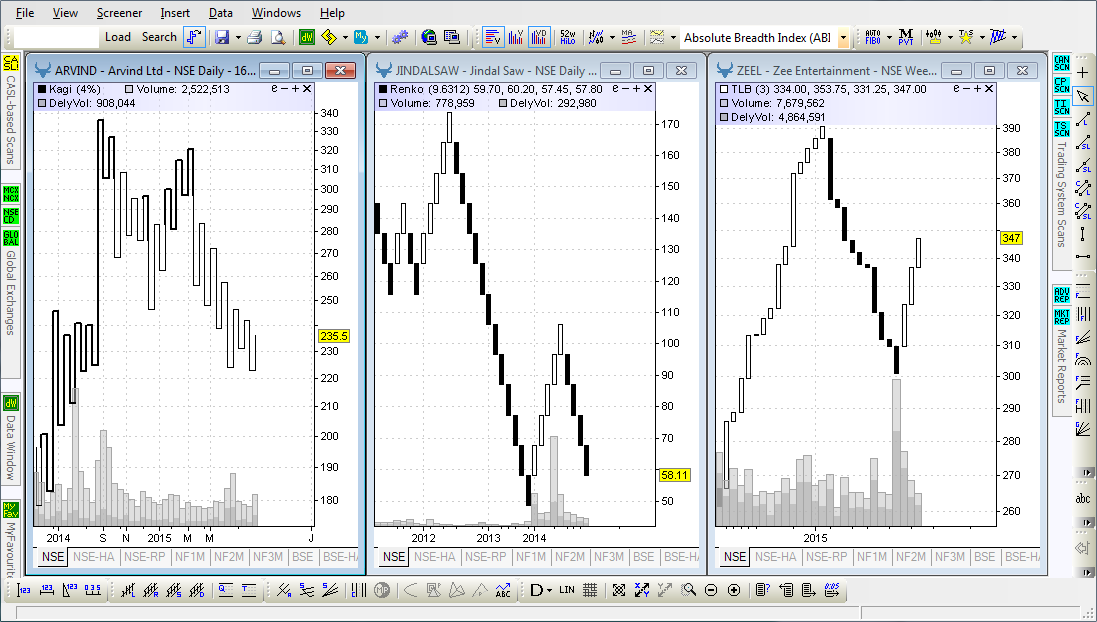
- ChartAlert® includes the following advanced chart types ...
- Kagi charts have thick and/or thin vertical lines and move up and/or down until a reversal occurs
- Renko charts have rising and/or falling boxes that are filled or hollow; they move in a diagonal line until a reversal occurs
- 3LB charts have a series of vertical white and/or black boxes and continue in a direction until a reversal occurs
- All these Japanese chart types ignore Time — that is, x-axis — and move across the y-axis only when the prices move by a certain amount
| Kagi | Renko | Three Line Break |
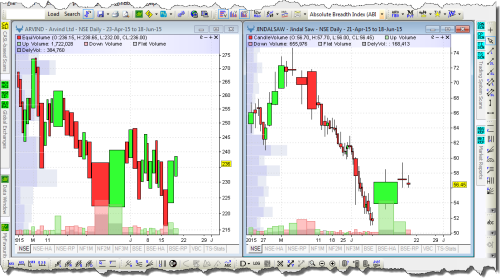
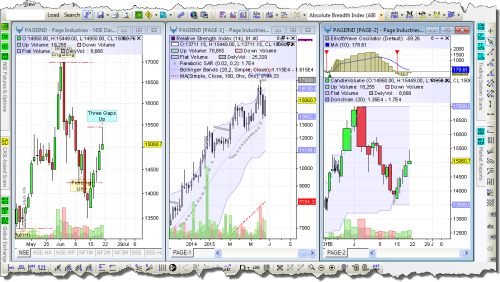
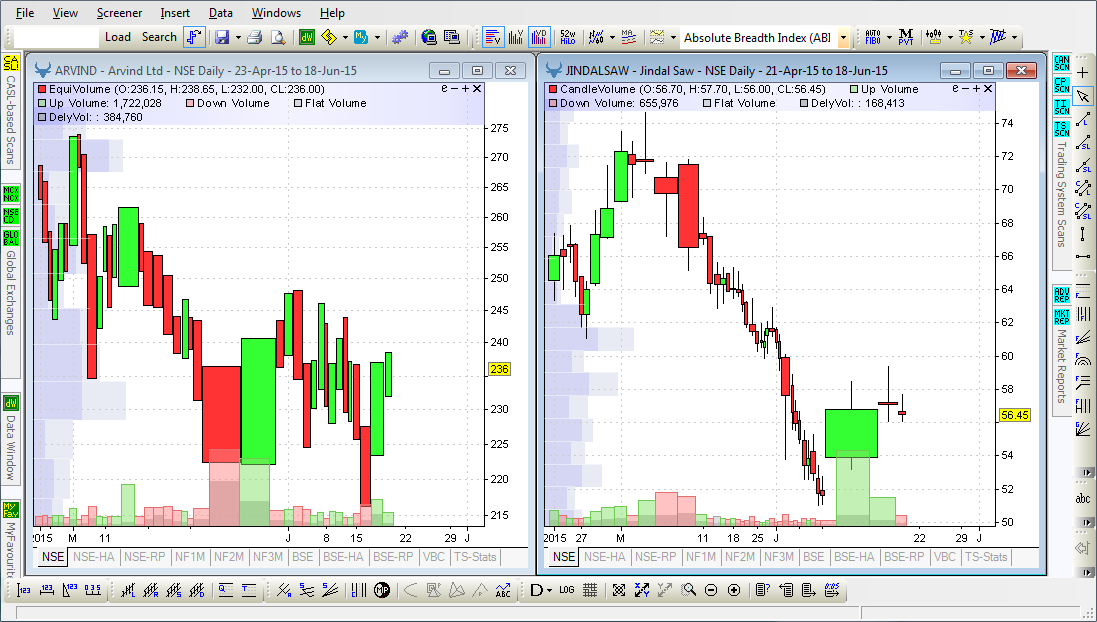
- ChartAlert® includes EquiVolume and CandleVolume charts
- EV charts combine Price/ Volume data of a symbol in a two-dimensional box, where the box width is based on the Volume of the day
- CV charts are hybrids, as they possess the shadows/ body characteristics of Candlesticks, and the Volume width attribute of EV charts, thereby presenting an opportunity to study Candlestick patterns along with their Volume-related movements
- Where these chart types are concerned, Volume, rather than Time, is the guiding influence of price change
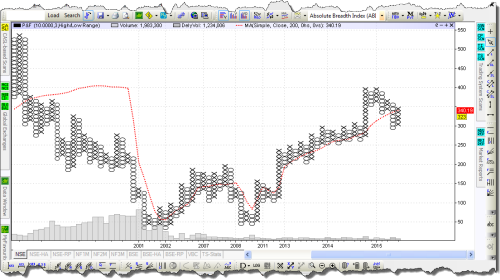
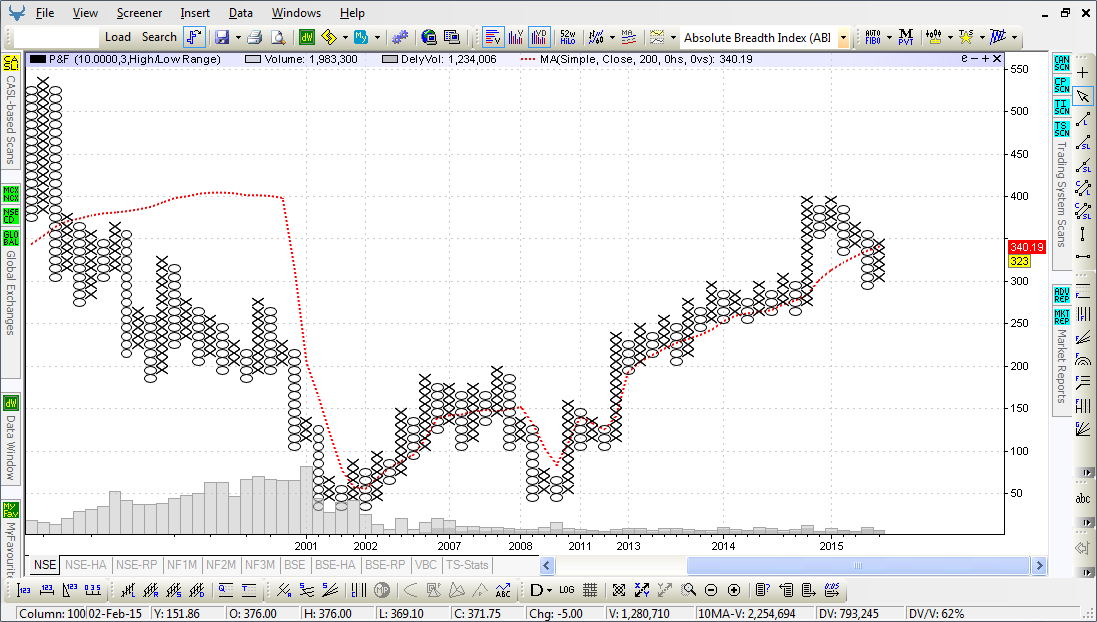
- ChartAlert® also includes the Point & Figure chart
- Designed for long-term investment, P&F charts have been described as one of the simplest systems for determining solid Entry/ Exit points, wherein supply/ demand is monitored while keeping a keen eye on developing trends
- Since the emphasis is on trends, and not with the noise created by minor Up/ Down moves, P&F charts ignore Time — that is, x-axis — and move only when the prices move by a certain amount
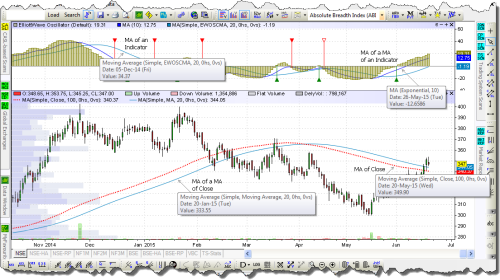
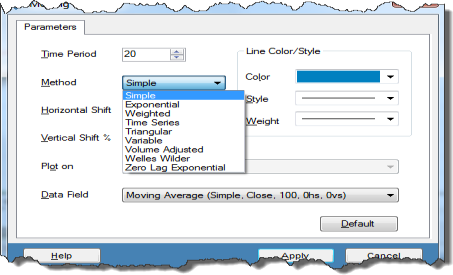
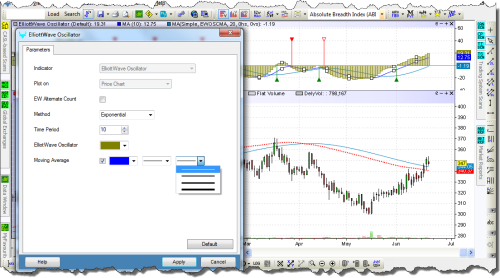
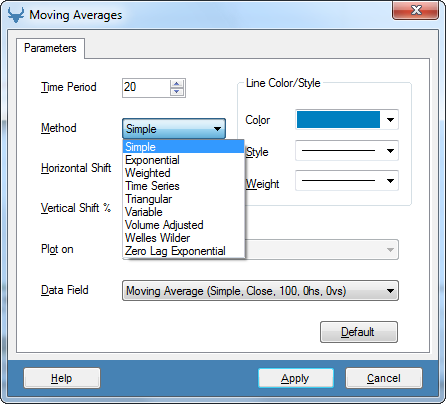
- ChartAlert® ships with 9 types of Moving Averages ...
- You can do all of the following ...
- ... Plot a Moving Average on the OHLC data
- ... Plot a Moving Average on another Moving Average
- ... Plot a Moving Average on an indicator
- ... Plot a Moving Average on a Moving Average of an indicator
| Simple | Exponential | Weighted | Time Series | Triangular |
| Variable | Volume Adjusted | Welles Wilder | Zero Lag Exponential |
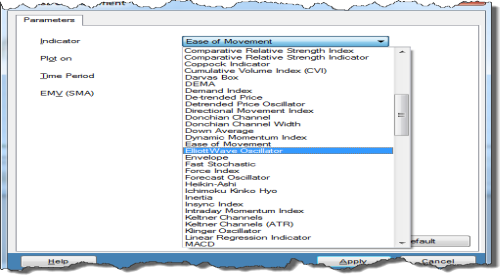
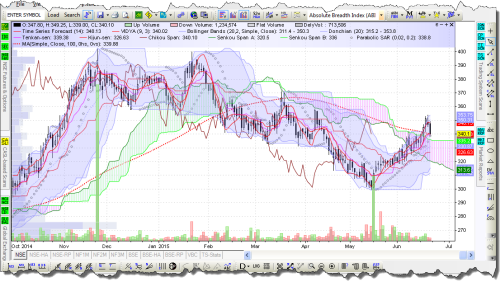
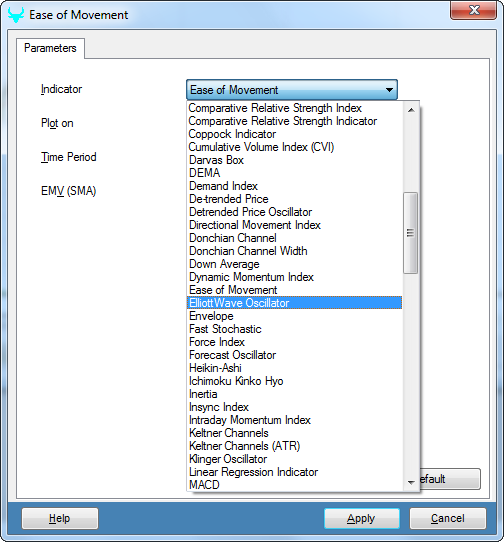
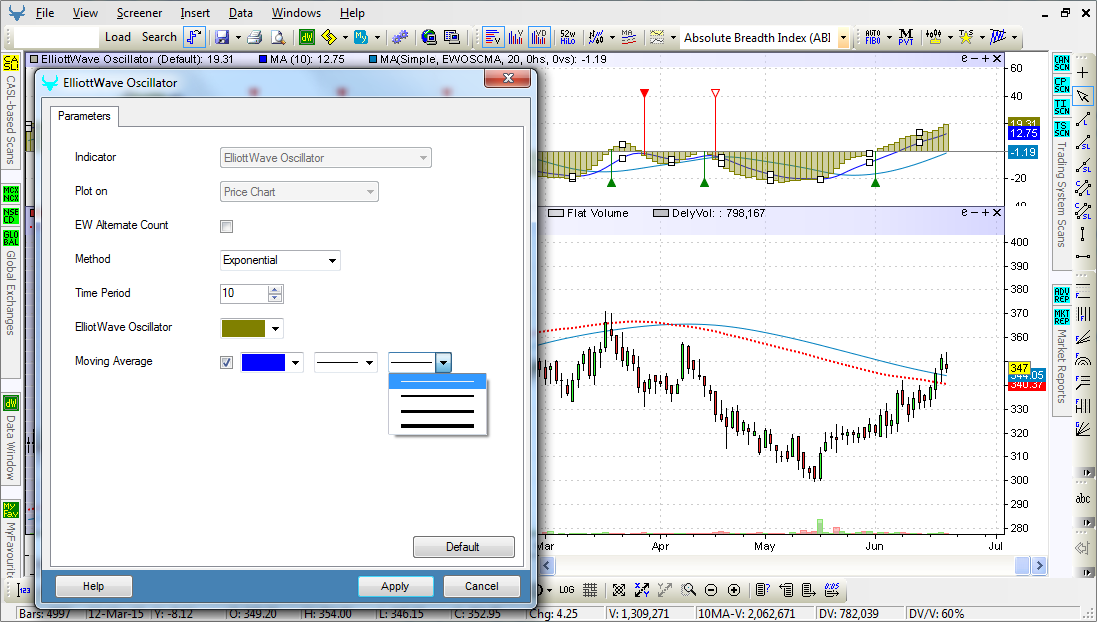
- ChartAlert® ships with over 120 Technical Indicators, which are the squiggly lines found above, below or on top of the price chart of a base symbol
- They are derived from the generic price activity of a symbol, and they look to predict future price trends, and/or the general price direction, by considering past patterns
- They are used by traders for analyzing short-term price movements, and/or to help identify Entry/ Exit points
Tons of Scanner Examples
ChartAlert® includes several Factory Scans — simply copy the scans, modify the parameters, include more filters, and re-use the resultant output.
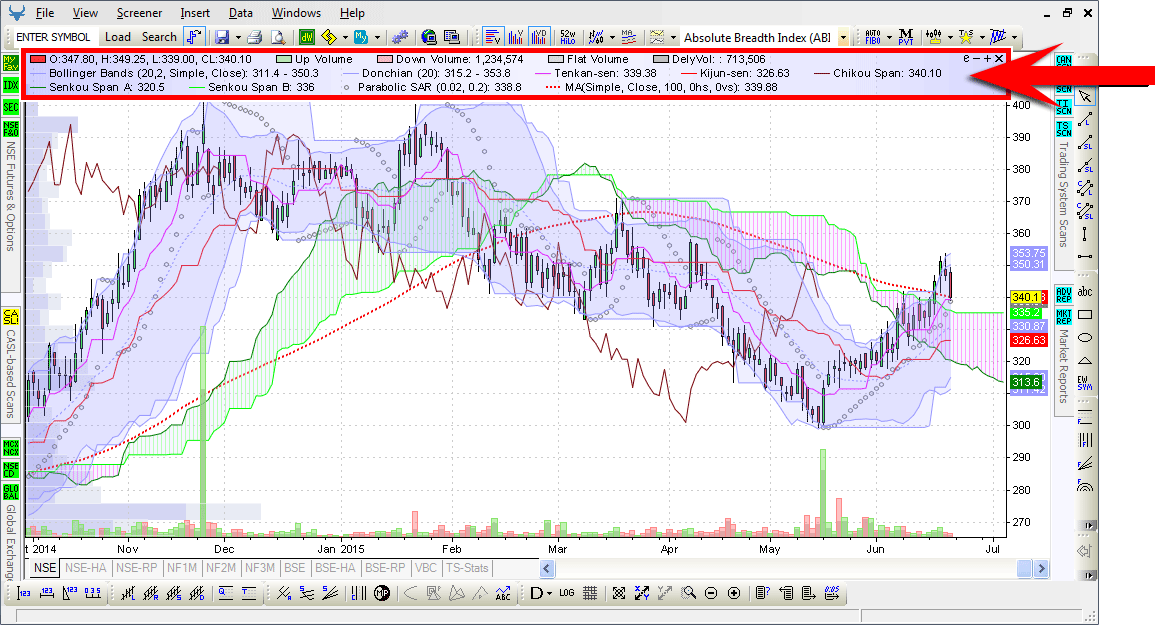
- Technical Indicators, the squiggly lines found above or below the price information of a chart, can also be plotted on top of the price information in a chart
- When plotted on top of the price chart, they are referred to as price plot or chart overlays
- ChartAlert® includes the following overlays ...
| Bollinger Bands | DEMA | Donchian Channels | Envelopes | Ichimoku Kinko Hyo |
| Moving Averages | Parabolic SAR | T3 | TEMA | Time Series Forecast |
| VIDYA | Wilder's Smoothing | Zero Lag EMA | ||
| TA — C@W — Mask | Candlesticks Mask | Chart Patterns Mask | Trading Systems Mask | |
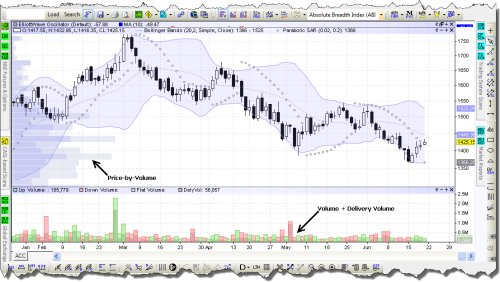
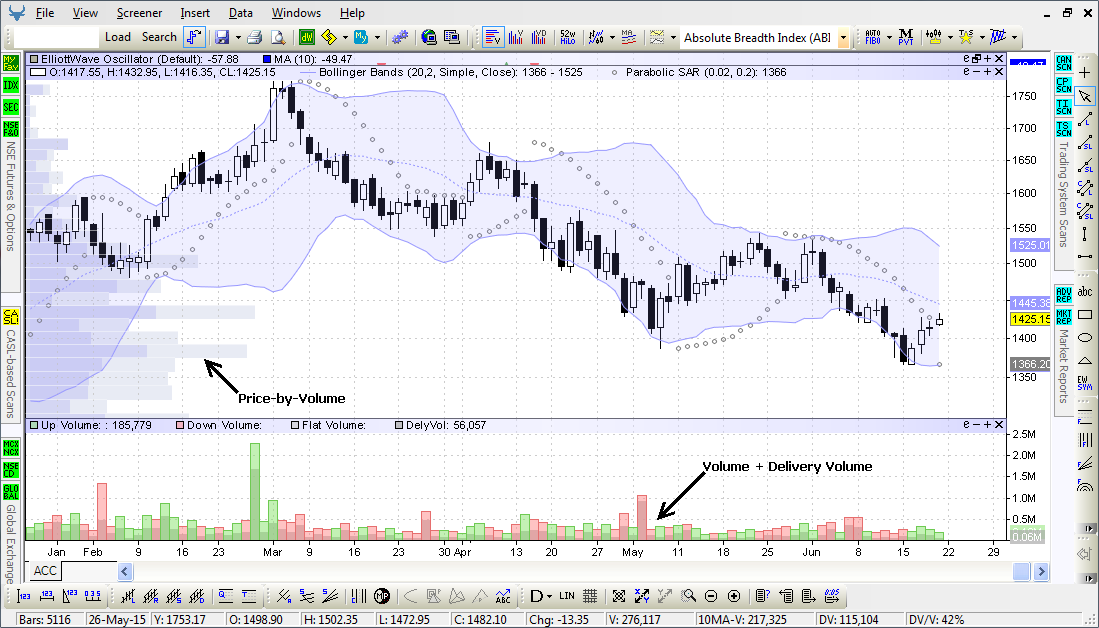
- ChartAlert® includes Volume, Delivery Volume and Price-by-Volume overlays for Stock charts, Open Interest contracts for stock Futures, and Open Interest for Commodities charts
- Volume and Delivery Volume can also be plotted in separate sub-windows above or below the price chart
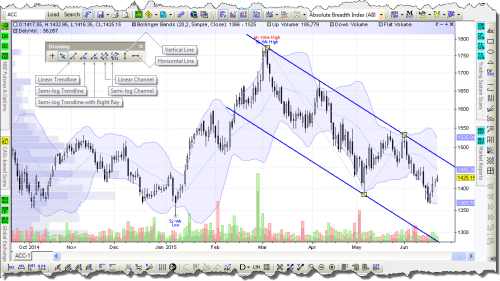
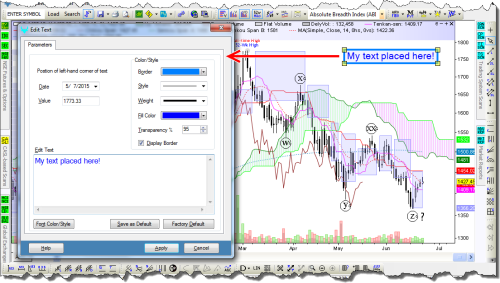
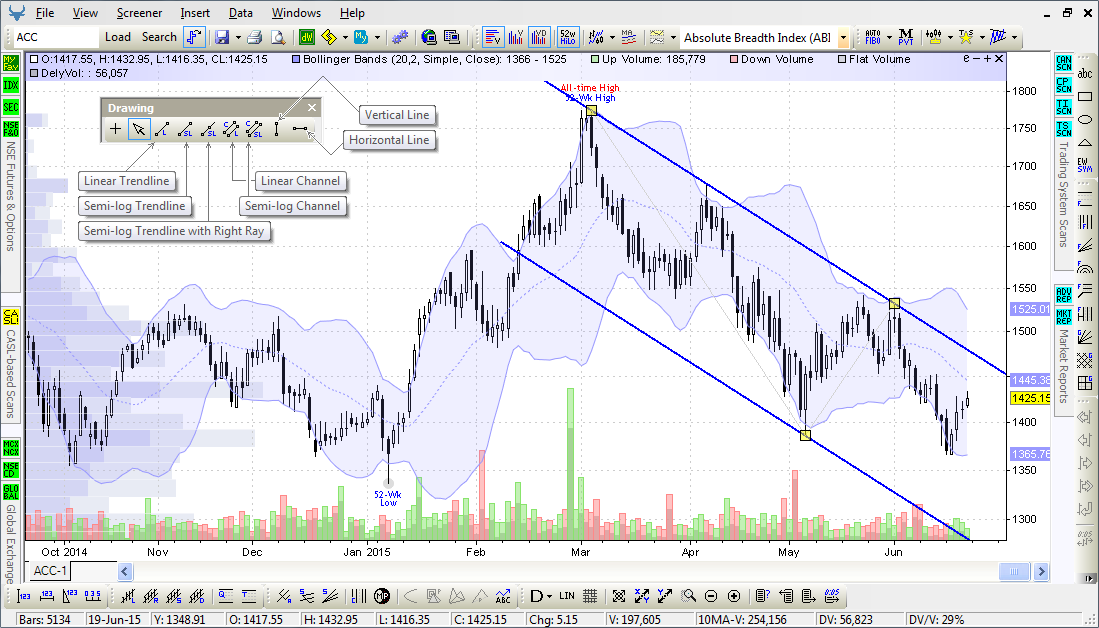
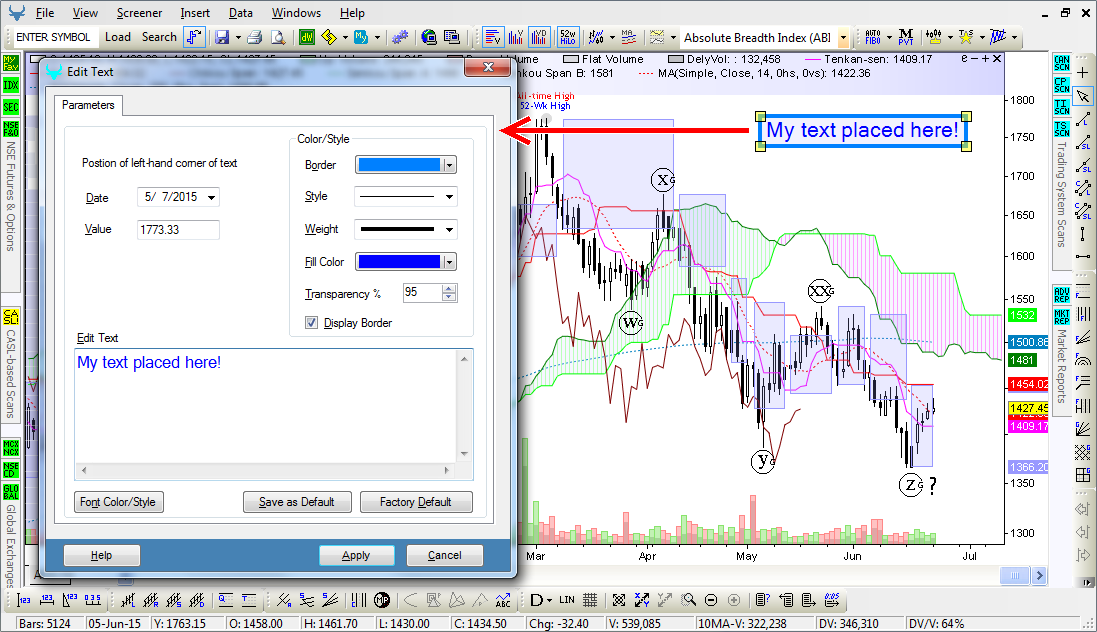
- Line studies, the fundamental construction tool of chart analysis, can be used to draw Trendlines to analyze chart patterns, help interpret price movement, and price-time relationship
- With analytical characteristics such as Slope, Channeling, Retracements, the Drawing Toolbar lets you draw the following ...
- You can draw, edit, delete, zoom, scroll and save them for future use
| Linear Trendline | Semi-Log Trendline | Semi-Log Trendline with extended Right Ray |
Vertical & Horizontal Lines |
| Linear Channel | Semi-Log Channel | ||
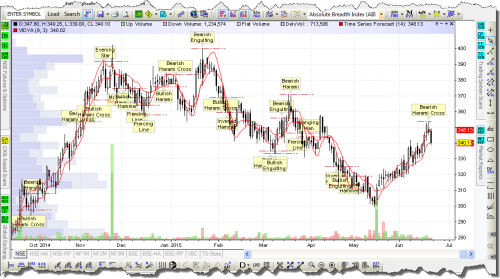
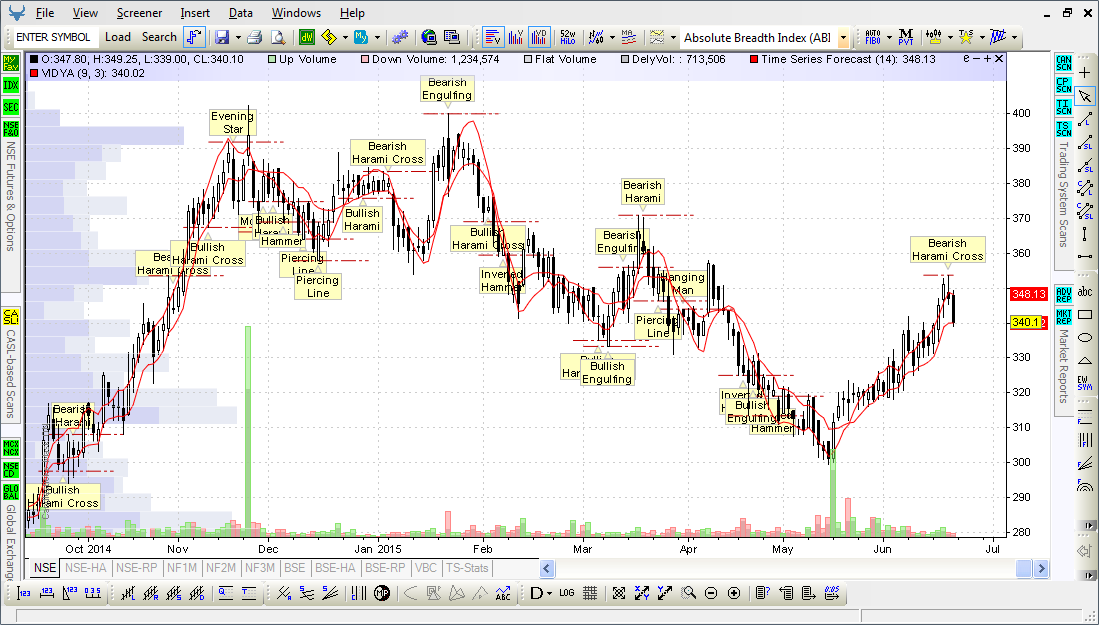
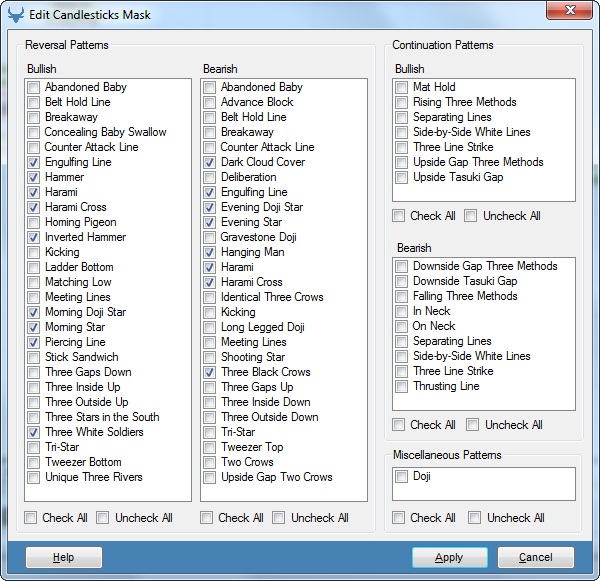
- The Chart Studies Toolbar includes the Candlesticks Mask, which is a template designed for stocks and commodities
- This Mask covers the following ...
- This Mask allows you to see End-of-Day, End-of-Week and End-of-Month Candlestick patterns labeled on the chart, thereby offering a glimpse into the psychology of trading activity
- This Mask can be a powerful tool when used in combination with other Technical Analysis tools
| 27 Bullish Reversal & 27 Bearish Reversal Patterns | 7 Bullish Continuation & 9 Bearish Continuation Patterns |
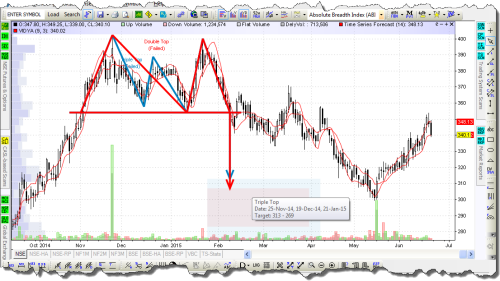
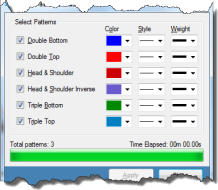
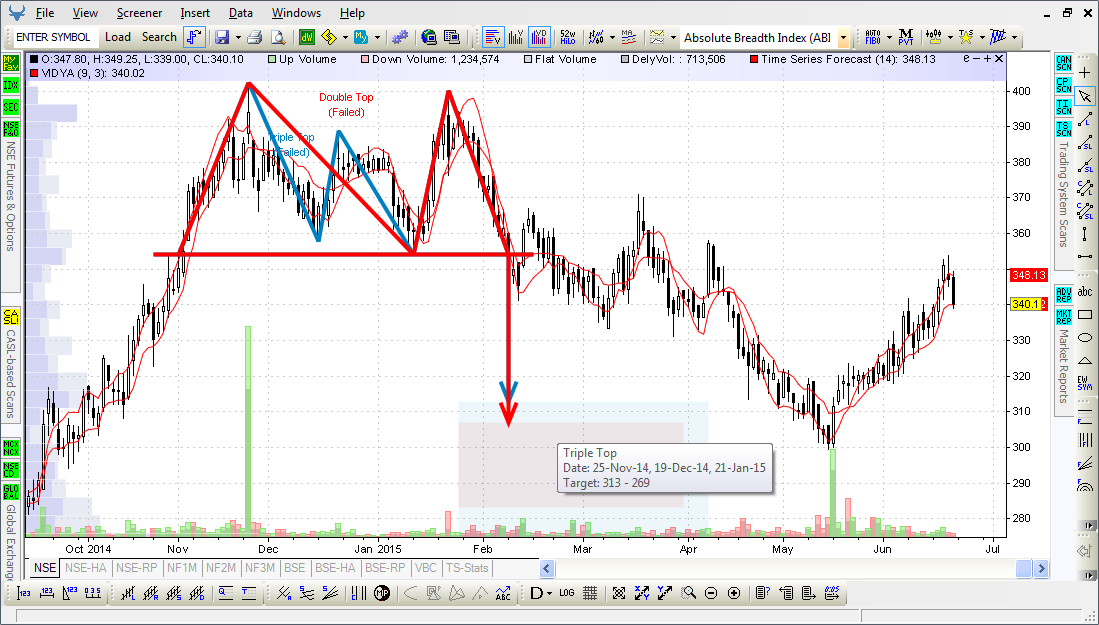
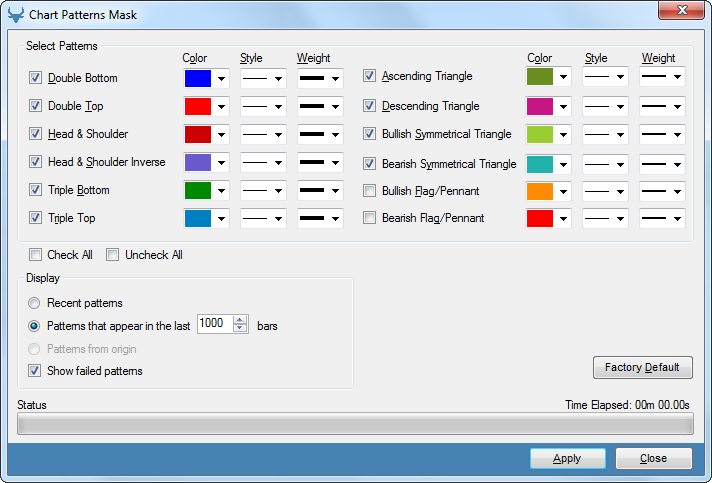
- The Chart Studies Toolbar includes the Chart Patterns Mask, which is a template designed for stocks and commodities
- This Mask covers the following ...
- This Mask allows you to see Chart Patterns labeled on the chart, thereby offering a glimpse into the psychology of trading activity
- This Mask can be a powerful tool when used in combination with other Technical Analysis tools
| Double Tops | Double Bottoms | Triple Tops | Triple Bottoms | Head & Shoulder | Head & Shoulder — Inverse |
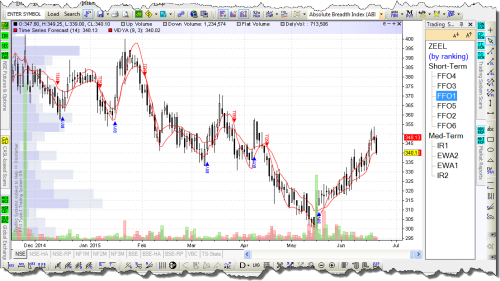
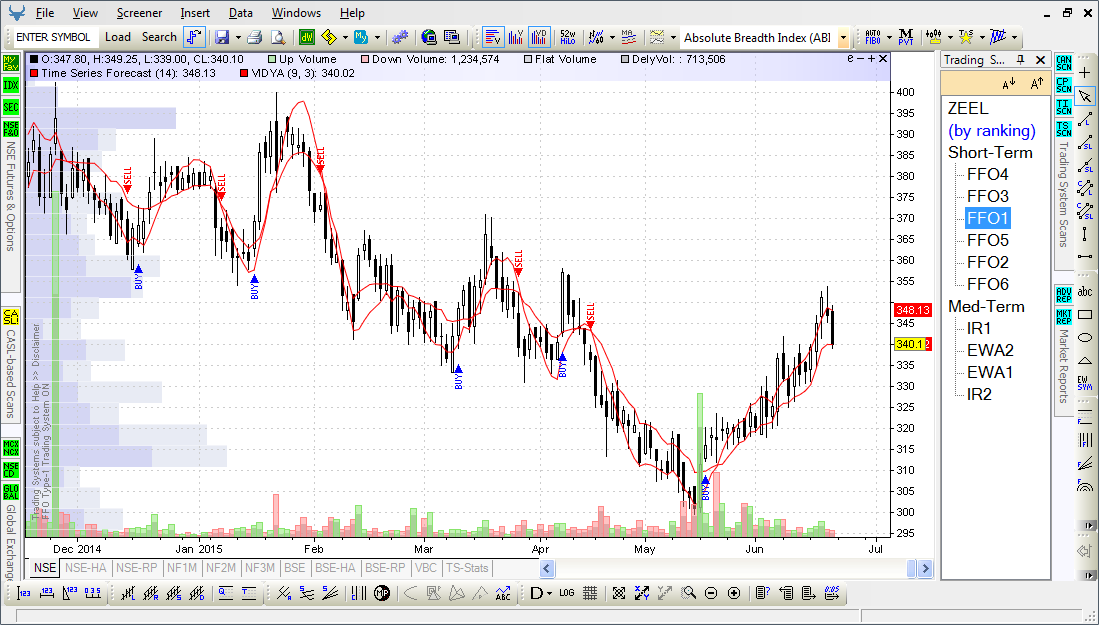
- The Chart Studies Toolbar includes the Trading Systems Mask
- Trading Systems are a collection of powerful analytical tools, that contain complete trading rules and complex analytical studies, to keep you informed about the current technical status of a symbol
- These short- and medium-term Trading Systems, screened and ranked for 50% of NSE's Cash Stocks, when applied as a chart overlay, display automated Buy and Sell signals on the chart
- The Chart Studies Toolbar includes the Technical Analysis (C@W) Mask, which is a template designed for 150+ NSE Futures symbols, including the 50 S&P CNX Nifty component Stocks
- This Mask allows you to see short-term, medium-term & long-term Trendlines, Channels, and important Supports & Resistances overlaid on a chart
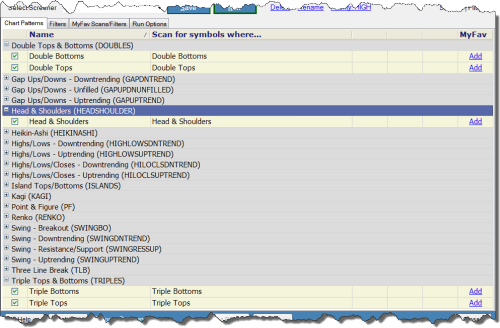
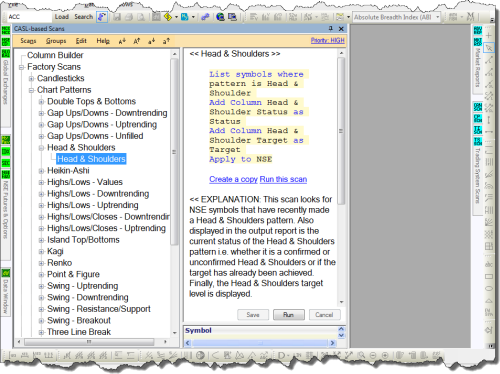
Scanner includes high quality Chart Patterns
Scan for high quality Double Tops & Bottoms, Triple Tops & Bottoms, and Head & Shoulders — more chart patterns are being added.
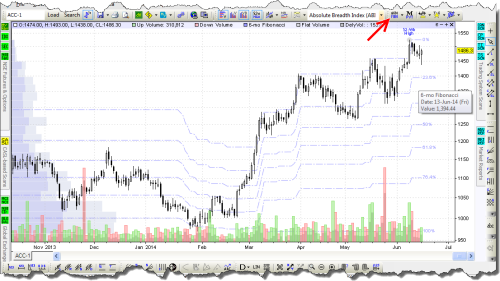
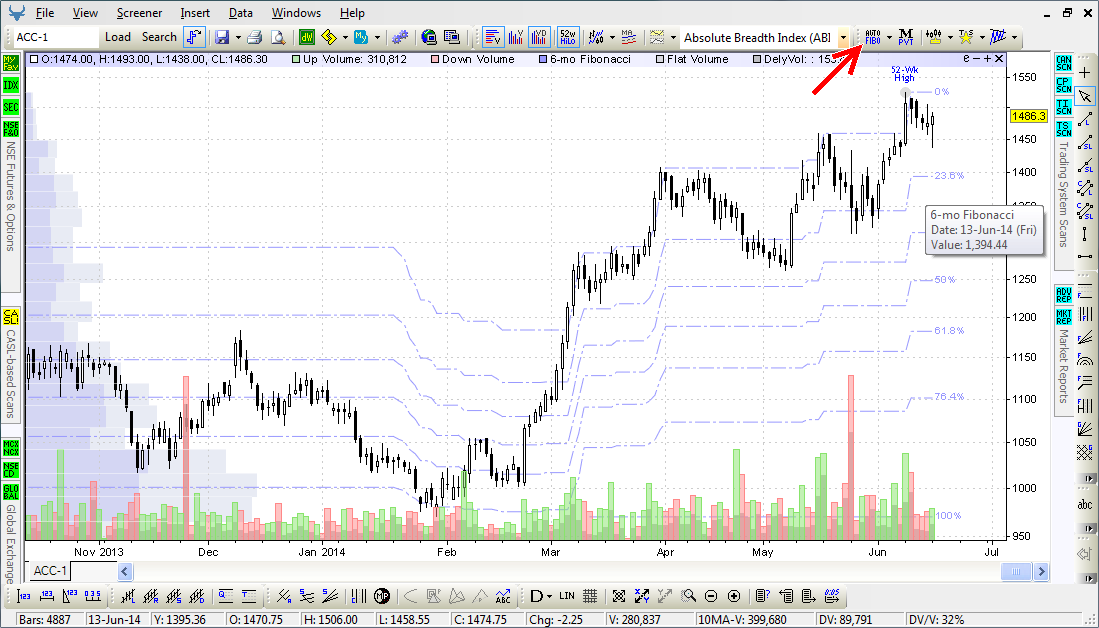
- The Chart Studies Toolbar includes innovative features that help re-interpret technical parameters of symbols in an unusually new perspective
- One of this feature is the AutoFibonacci function, that helps plot Fibonacci Retracement Zones — Support & Resistance levels — for a fixed period of 4-wks, 3-mo, 6-mo and/or 12-mo
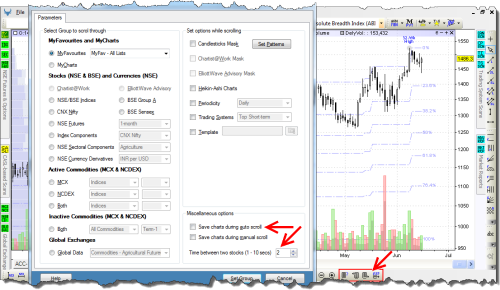
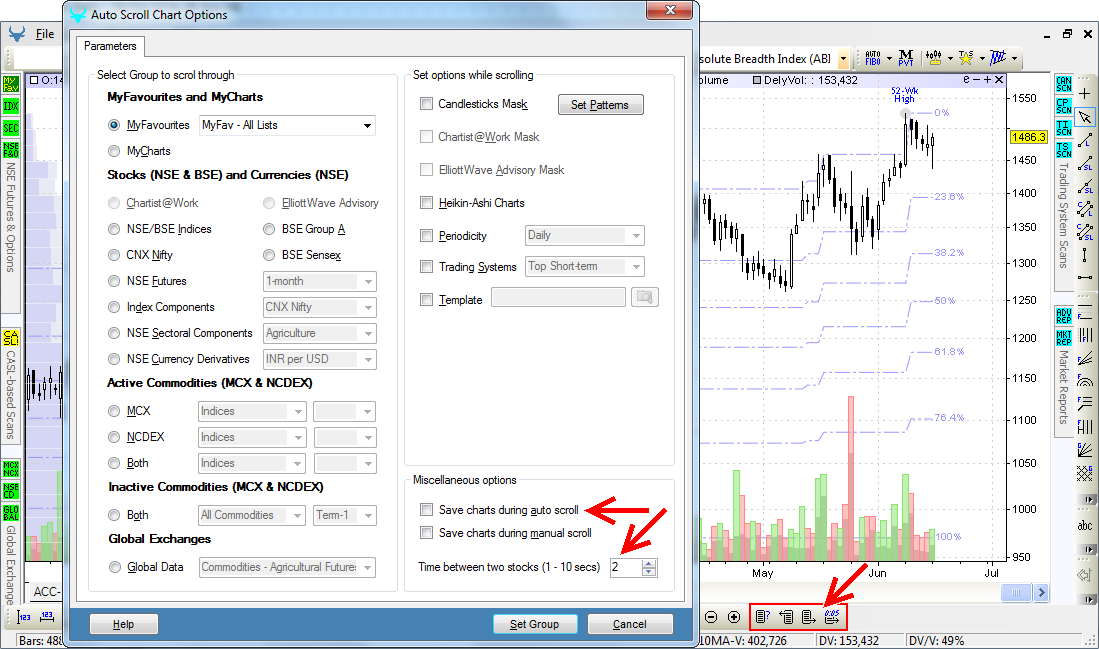
- ChartAlert® allows you to AutoScroll forward or backward through a group of charts
- AutoScroll is a hands-free feature, in the View Toolbar, that scrolls through charts based on a timer set by the end-user
- Options are available to also let you manually scroll through a group of charts
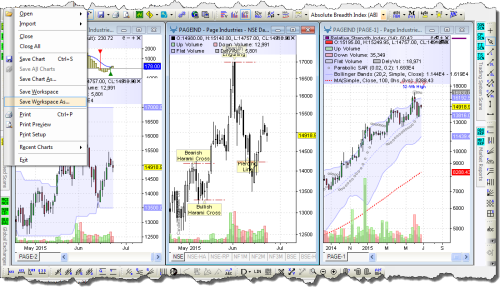
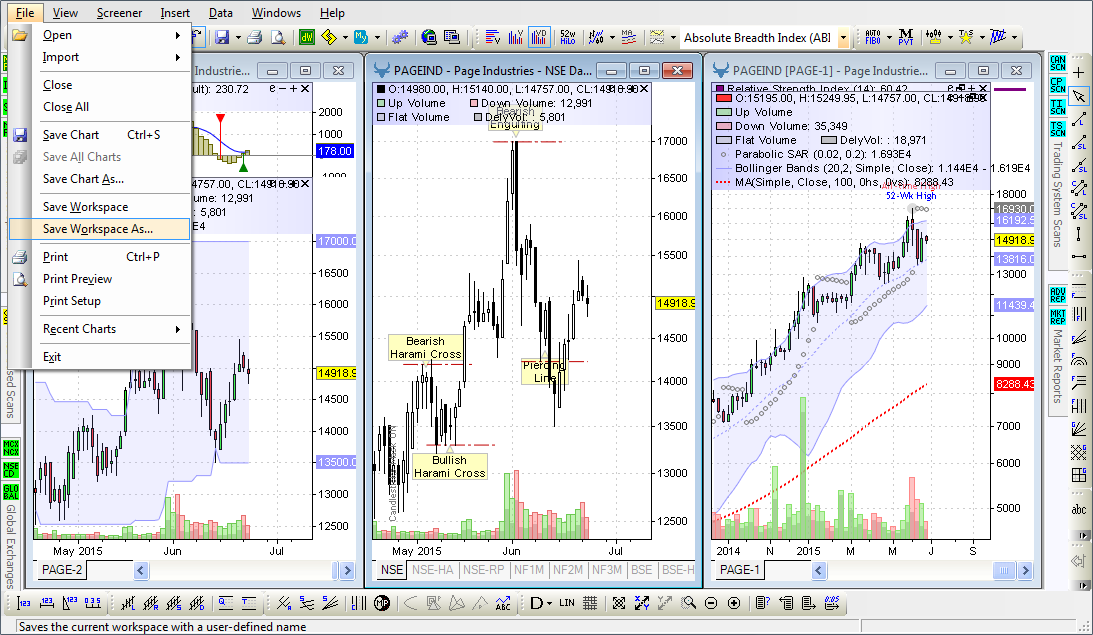
- ChartAlert® allows you to store multiple chart Workspaces — a Workspace remembers window locations and sizes and restores them when it is opened
- It remembers the state of the Chart Studies, Line Studies, Price Overlays, and can be customized with different charts, reports, windows, etc
- It also enables you to view your favorite charts or reports without having to repeatedly open/ resize/ move windows to the locations you are accustomed to
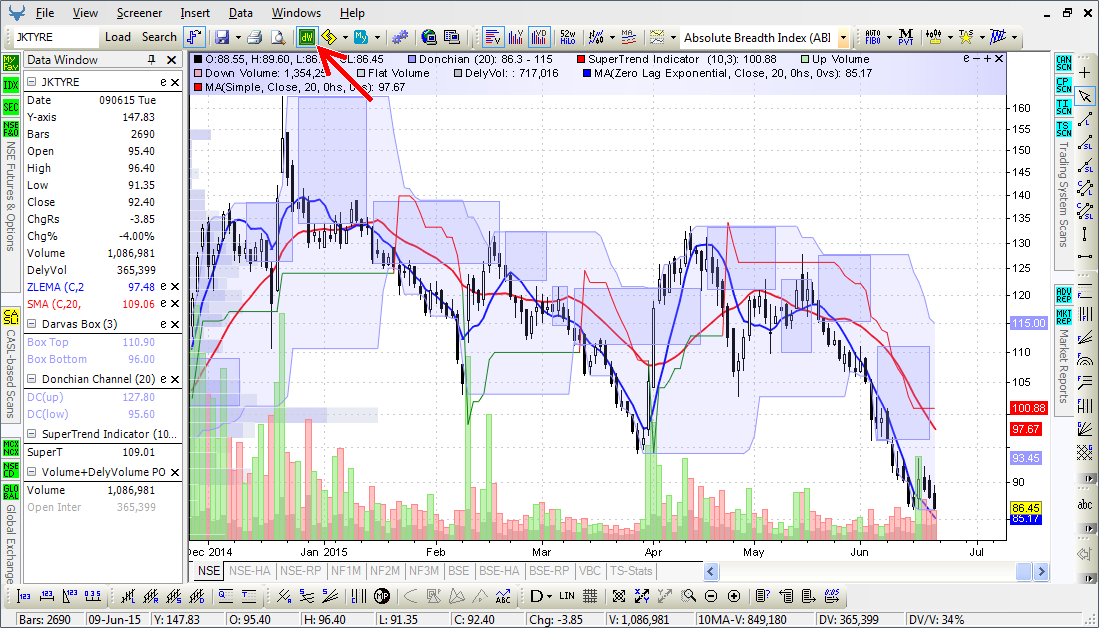
- The Standard Toolbar in ChartAlert® includes a Data Window, which when enabled, displays price information, and all other Technical Analysis information pertaining to the Technical Analysis Studies plotted on the current/ open chart
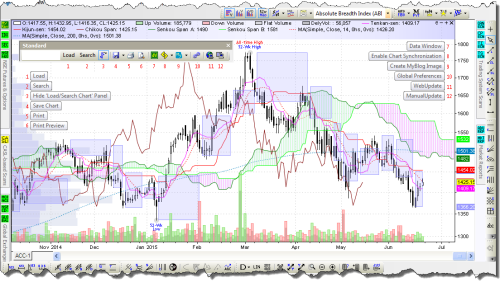
- ChartAlert® includes Heikin-Ashi charts for Stocks and Commodities
- These charts are considered extremely useful for making Candlestick charts more readable, as trends can be located more easily, and trading opportunities can be spotted at a glance
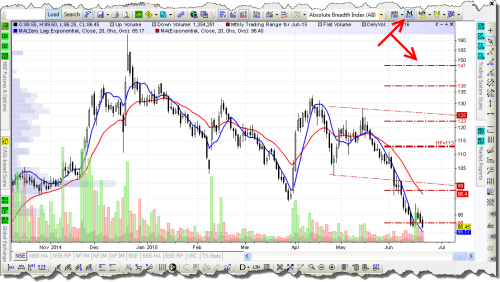
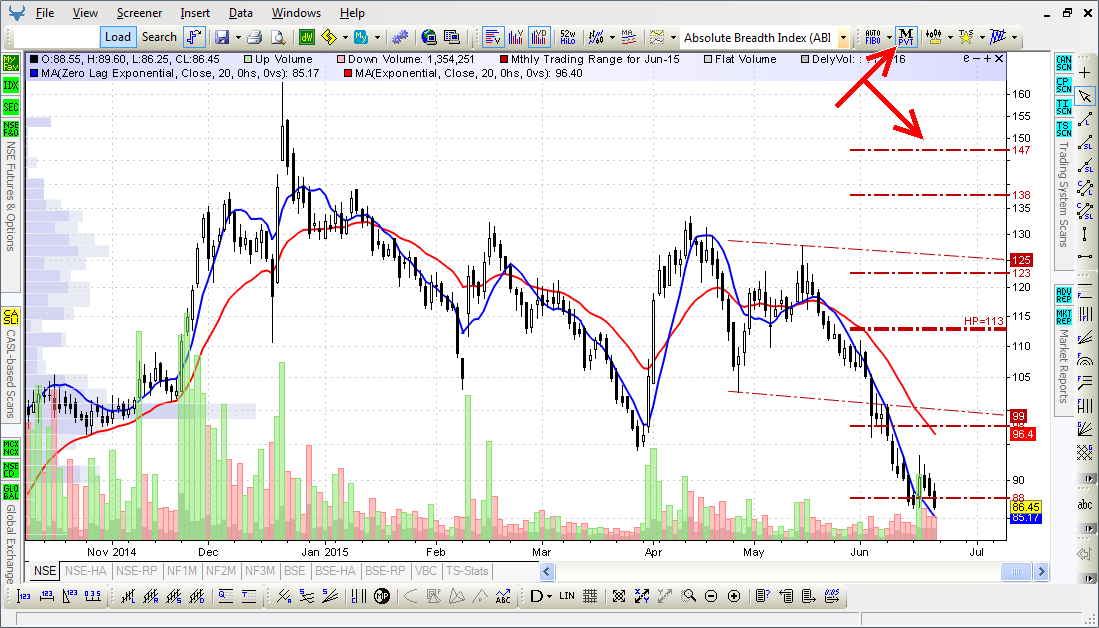
- The Chart Studies Toolbar also includes another innovative feature — the Monthly Trading Ranges function
- The MTR function plots Supports and Resistances for the upcoming 1-mo period which can be particularly helpful in trading the 1-mo NSE Futures or near-term Commodities contracts
- The MTR function, when plotted as an overlay on the chart, displays a trending Price Channel, which is expected to be the principal guide for the contract being tracked
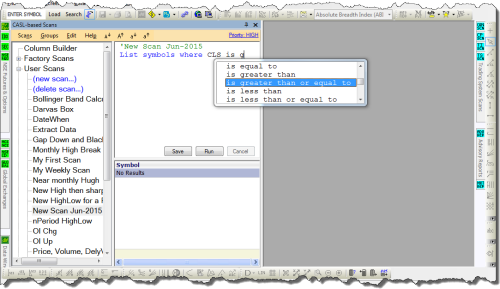
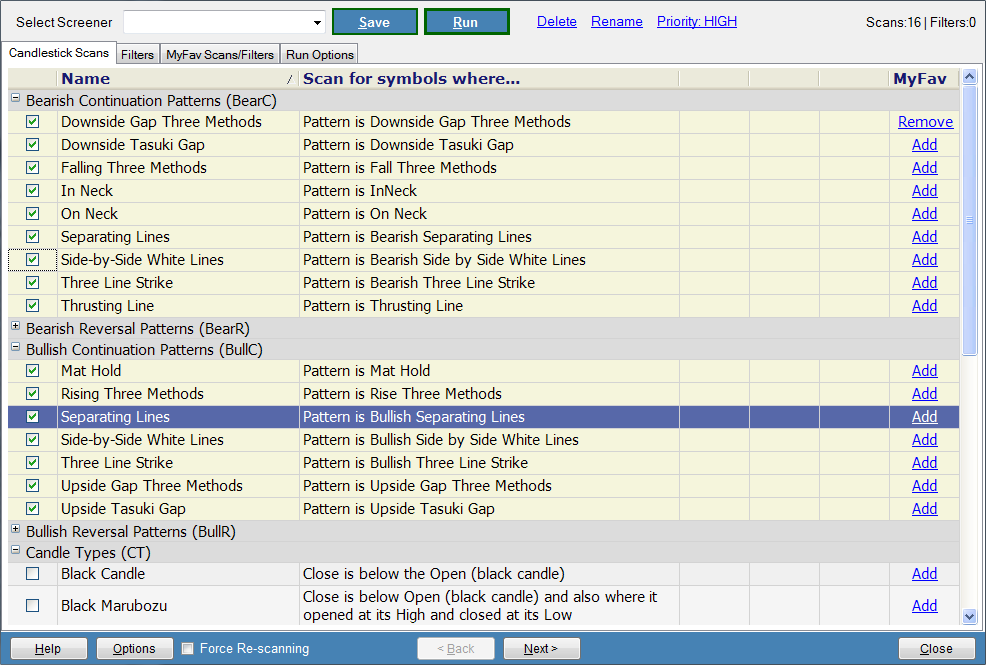
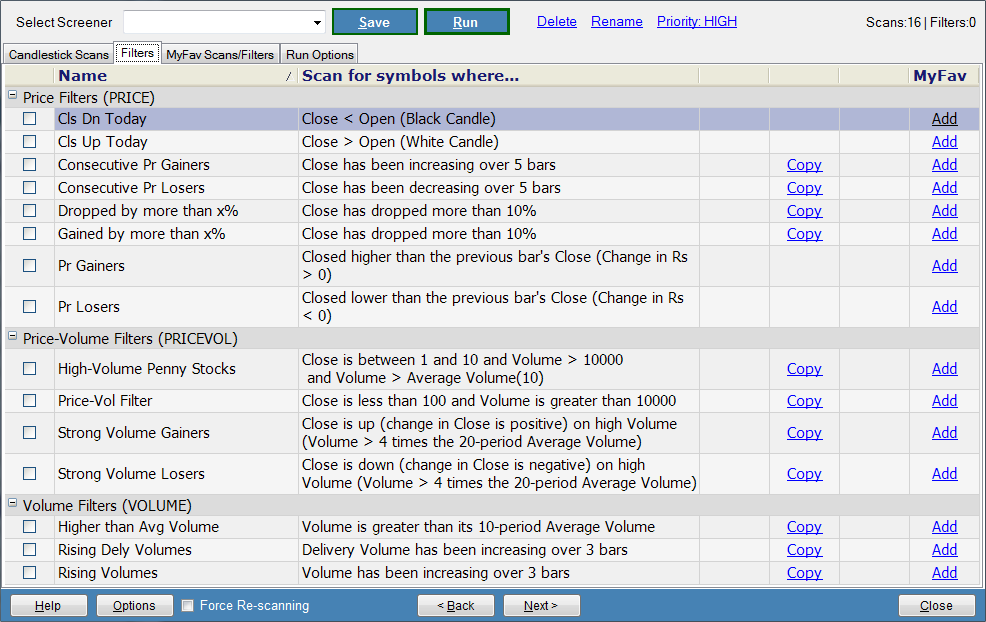
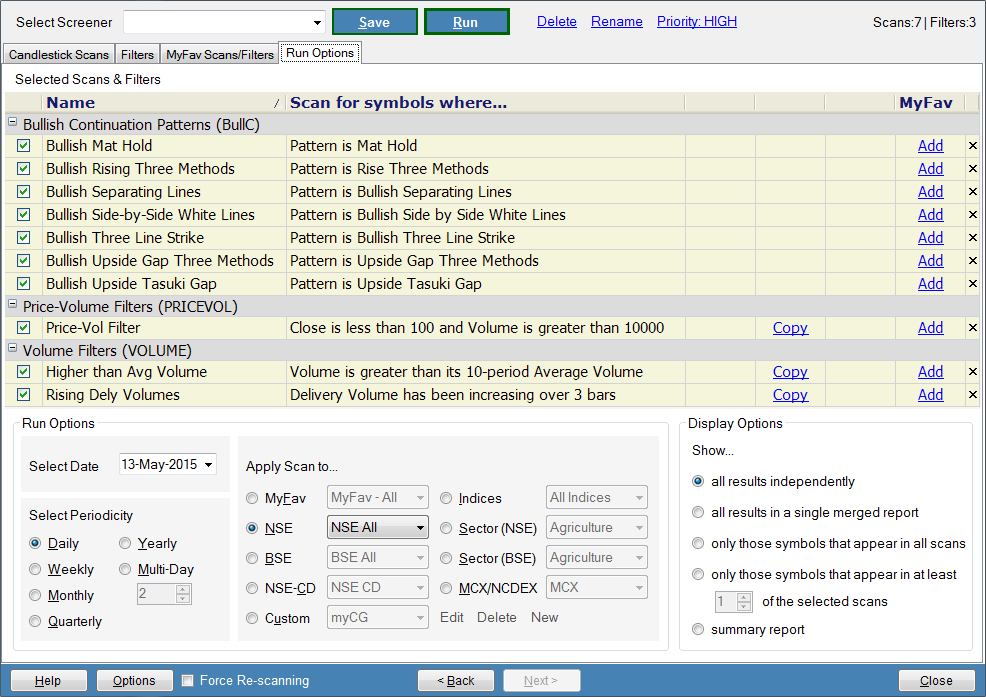
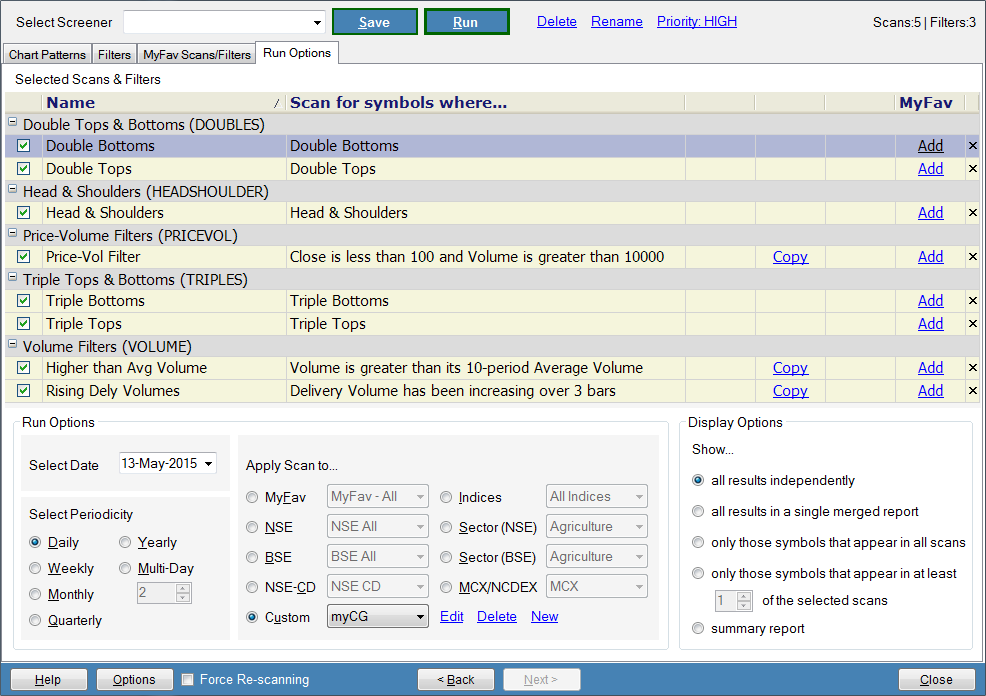
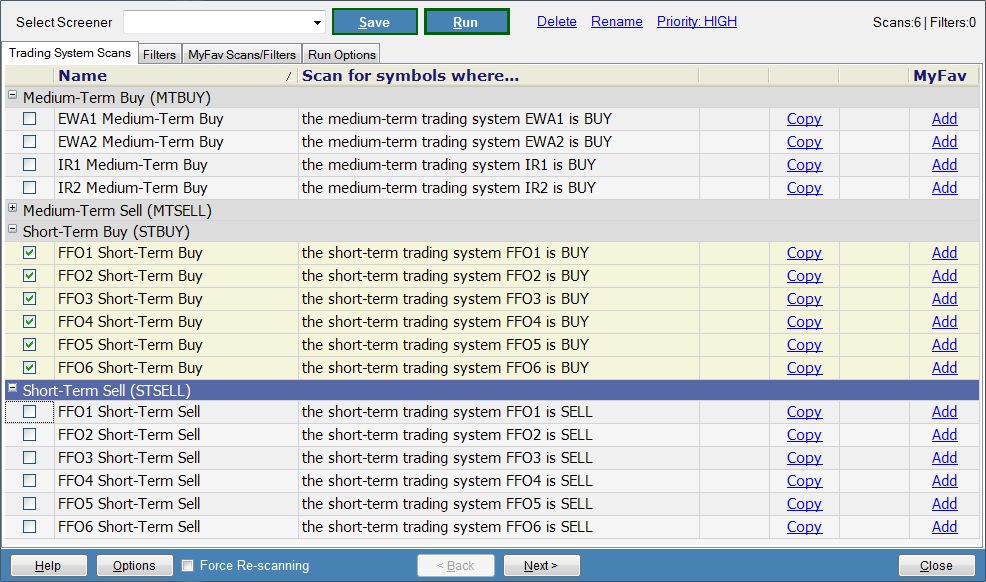
Basic Scanner — Extremely Easy to Use
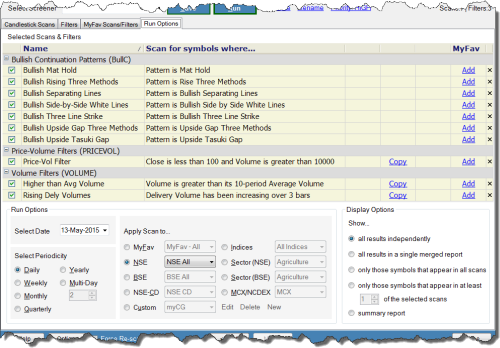
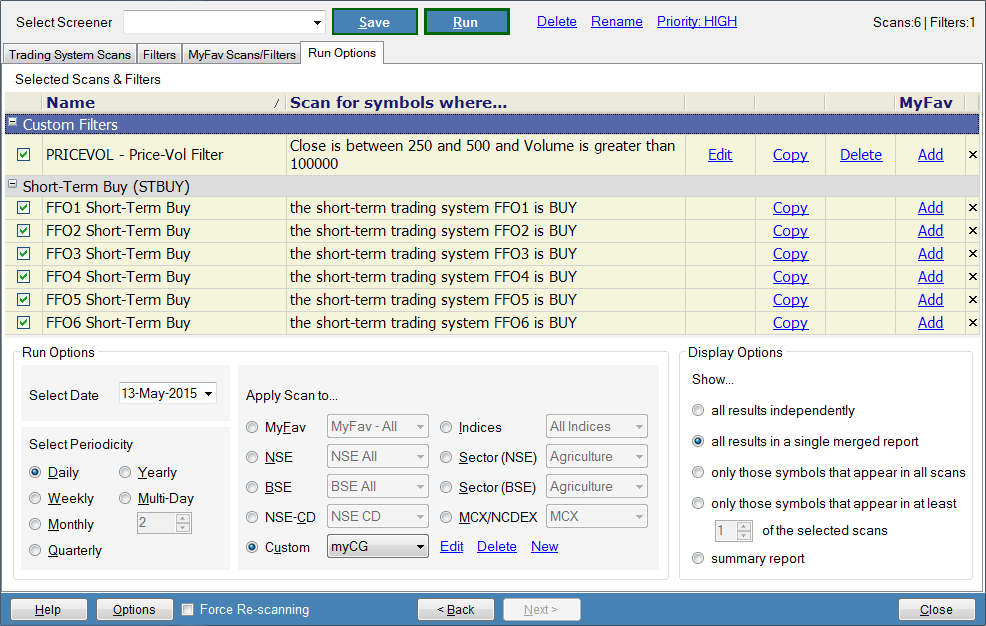
With the menu-driven interface in the Basic Scanner, it is very easy to modify the scan parameters, modify and/or apply multiple filters, and/or combine multiple scans into a single screener.
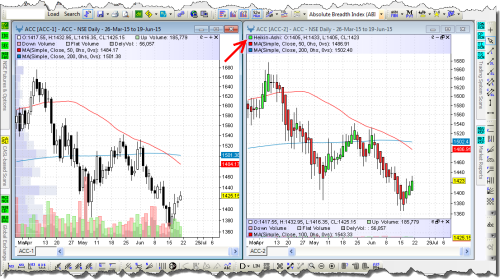
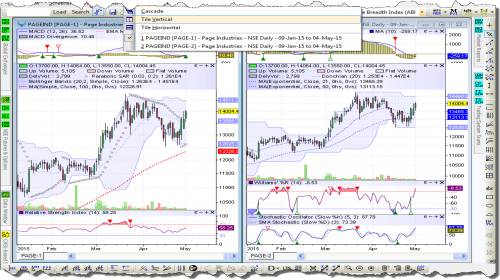
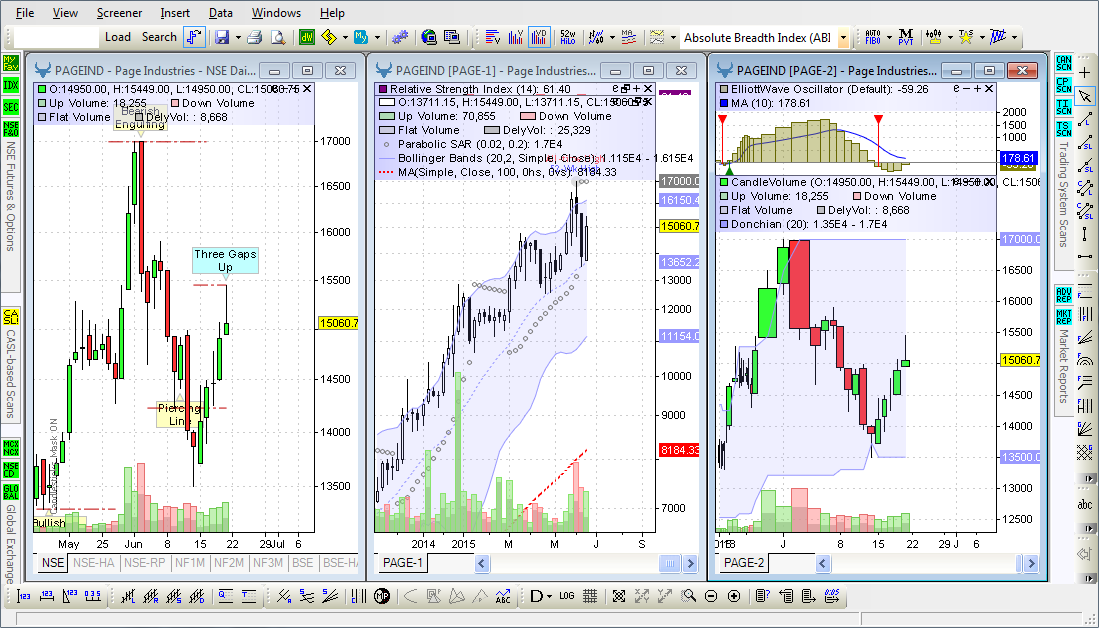
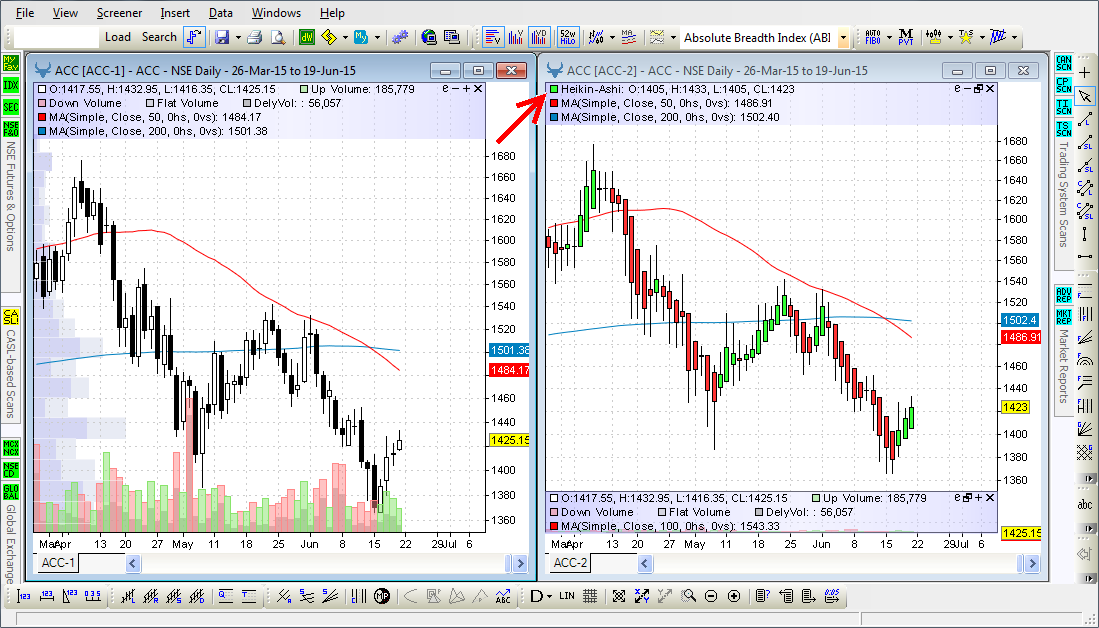
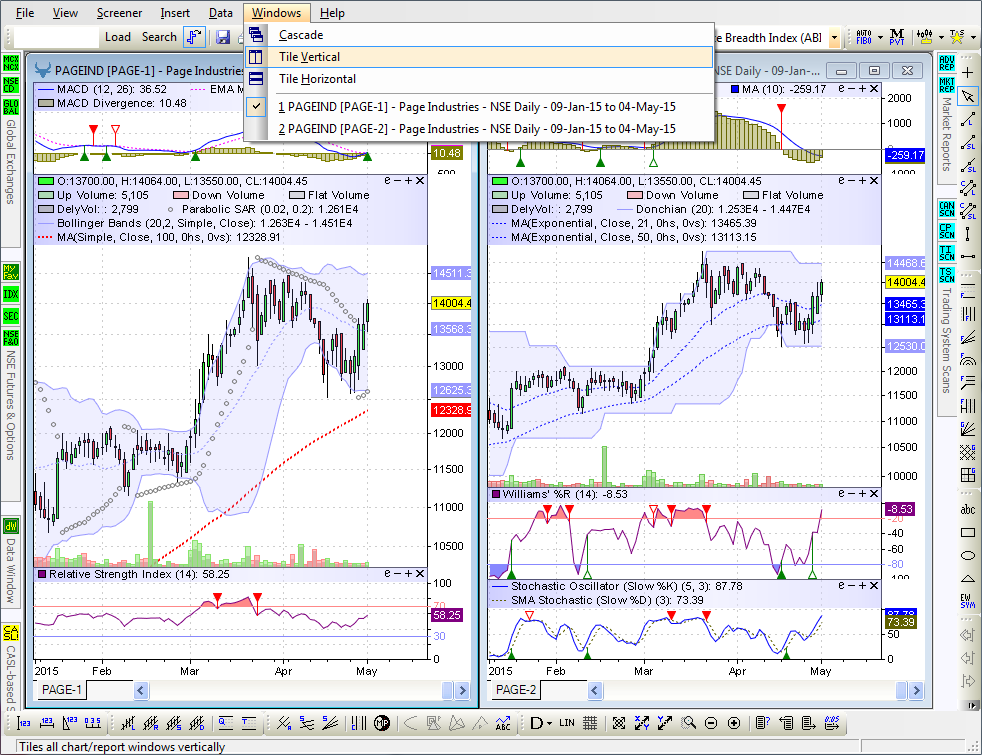
- ChartAlert® allows creation of multiple instances of a chart/ symbol, wherein you could create and view (simultaneously) the same symbol — say, ACC — with different templates — say, Moving Averages, Technical Analysis Studies, Line Studies, etc — plotted on the various charts (or instances) of the same symbol (in this case ACC)
- You can tile multiple charts of the same symbol — say, ACC — vertically or horizontally for visual analysis
- You can synchronize x-axis of said multiple ACC charts for left-and-right scrolling
- You can also save said multiple ACC charts to a single Workspace
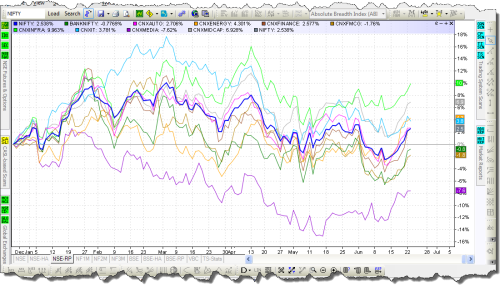
- ChartAlert® includes a Relative Performance function for Stocks
- The Relative Performance function allows you to plot upto 10 symbols on a base symbol to study their Relative Performance over any given period of time
The Relative Performance function will also be enabled for Commodities in a future version
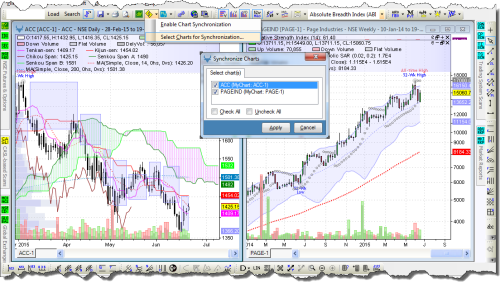
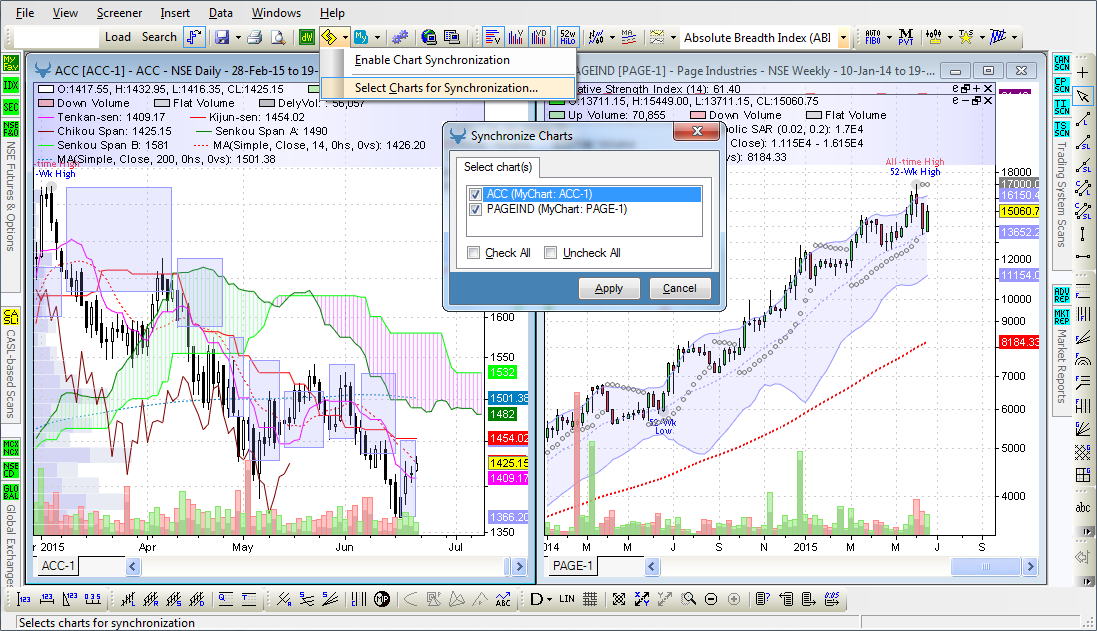
- This feature helps synchronize the x-axis — that is, time-scale — of more than one chart — be it an Index, Stock, Commodity or Forex chart — to enable synchronized left-and-right scrolling
- Synchronized charts can be scrolled under both the Tile Vertical and Tile Horizontal windows options
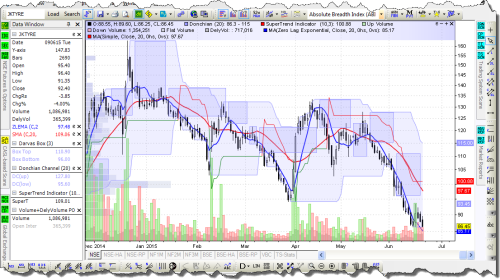
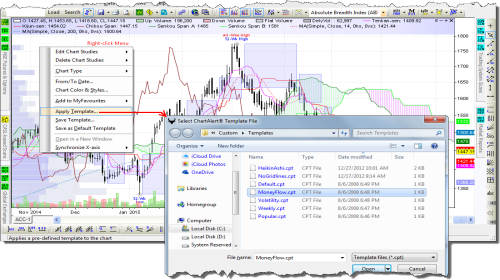
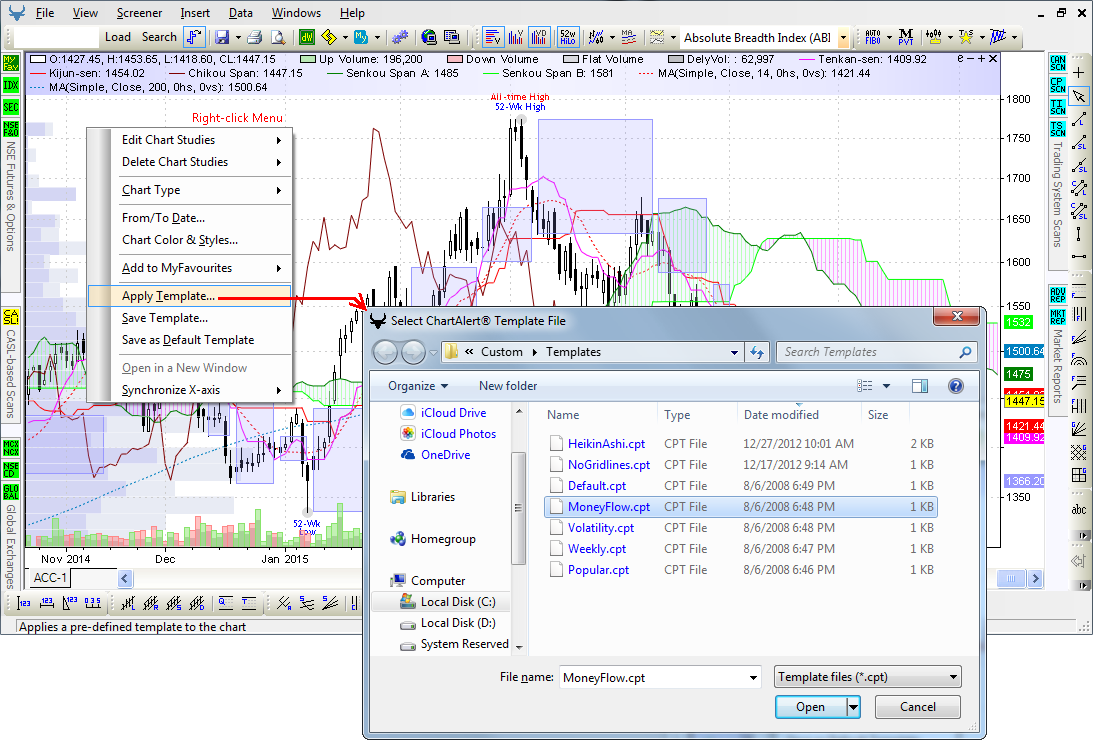
- Templates, or Chart Layouts, are custom files created by end-users, and contain technical parameters of a chart
- Let us suppose you like to analyze symbols with DMI, MACD, RSI, Stochastics, Bollinger Bands, Parabolic SAR, 20-/ 50-/ 100-/ 200-day EMA ...
- ... You could save all this information in a Template and apply it to any other symbol with just 1-click
- ... The result — 10 Technical Analysis studies plotted in any chart with just 1-click
- You can create unlimited number of Templates — once created, a Template can be used over and over again
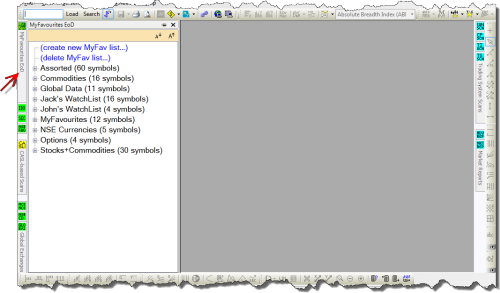
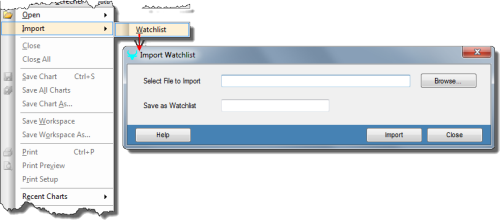
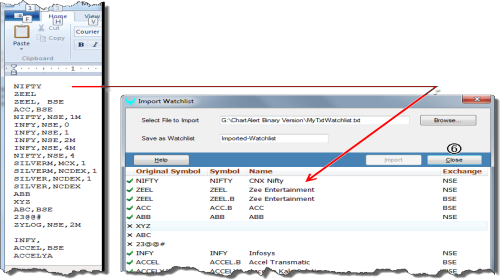
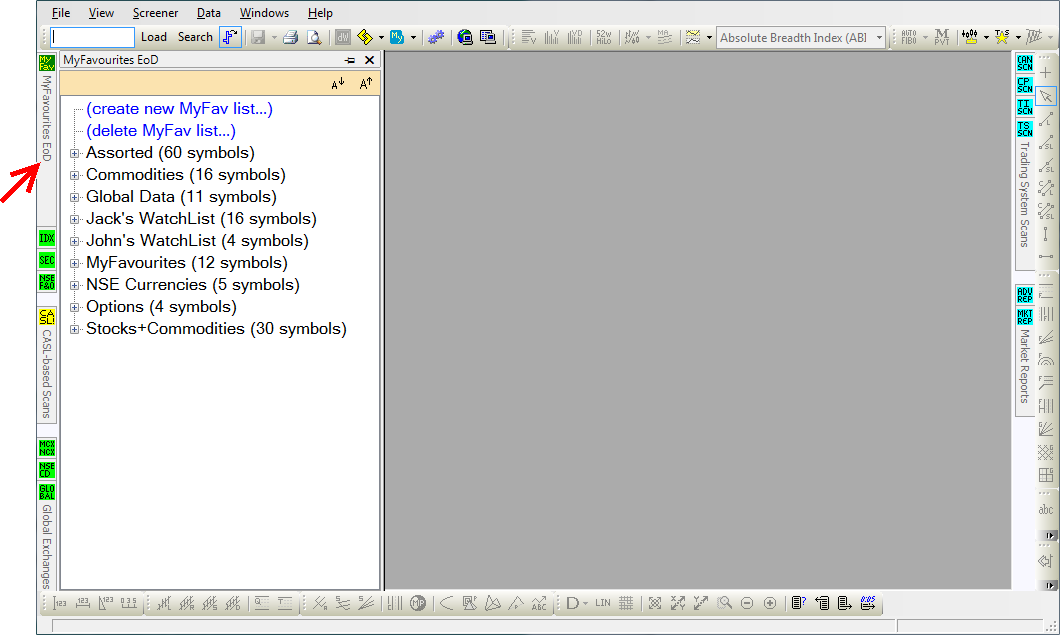
- ChartAlert® allows you to create multiple WatchLists, with multiple symbols per WatchList
- You can do all of the following ...
- ... Drag-and-drop between WatchLists
- ... Add to WatchLists from open charts and/or reports
- ... Rename/ Delete/ Merge WatchLists
- ... Scan WatchLists for trading opportunities
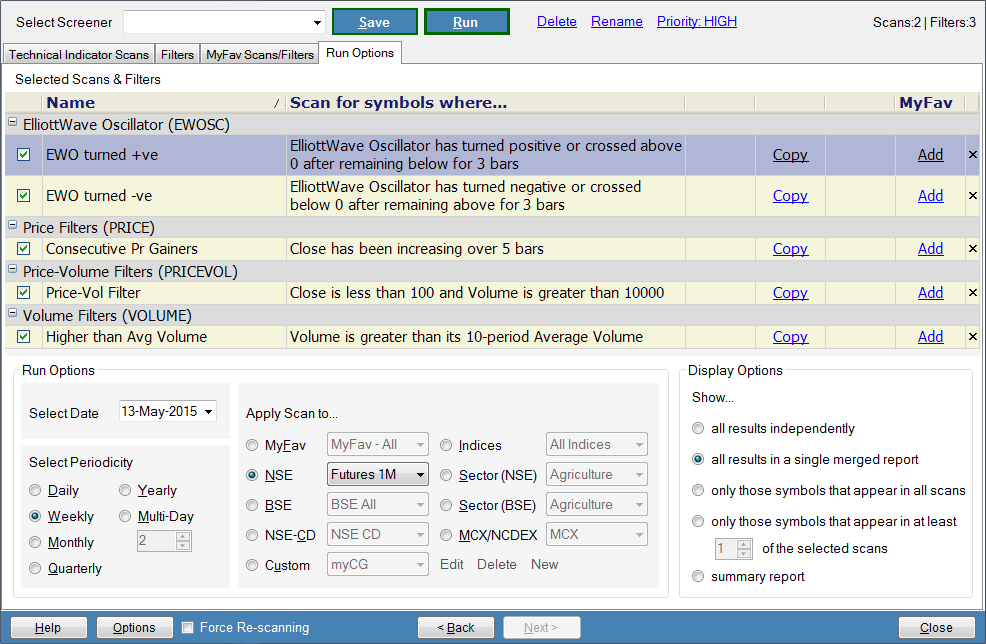
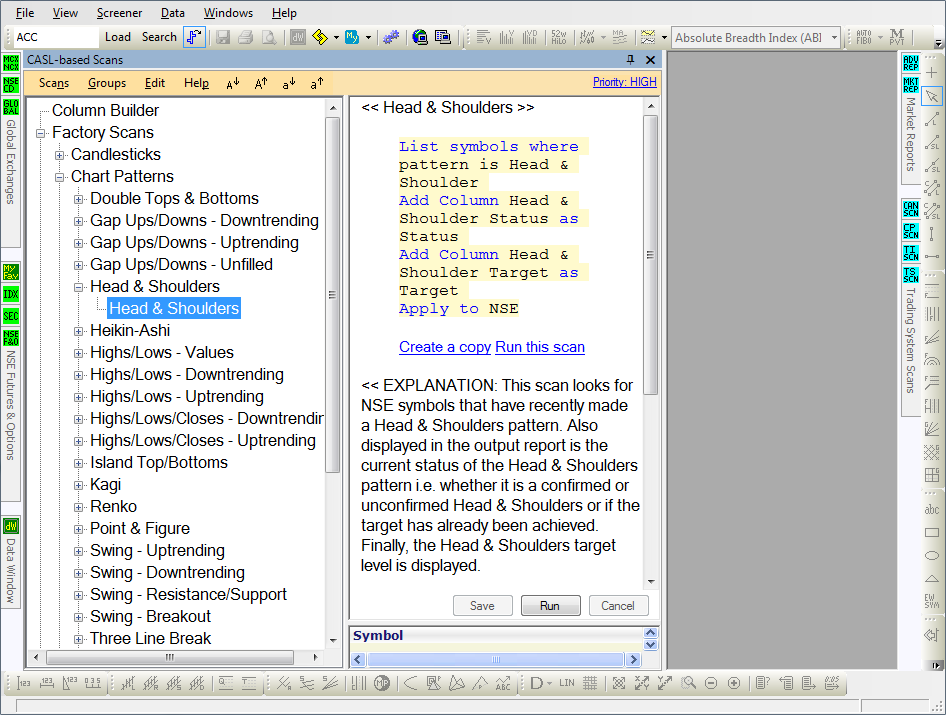
Advanced Scanner — Script-based Interface allows for Intricacies
Write your own intricate scans, apply your own elaborate filters, combine multiple scans into a screener, and even run scans across candlestick/ chart pattern/ technical indicator segments.
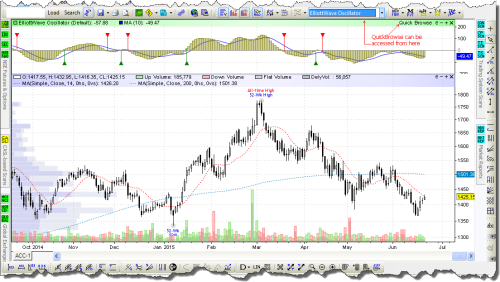
- The Charting Toolbar also includes the QuickBrowse feature, which allows you to quickly browse through all available indicators for a particular symbol by using the up and/or down arrows on the keyboard
- At the click of a button, the Toolbar can also plot 52-Week and All-time or Life-time Highs and Lows on the chart
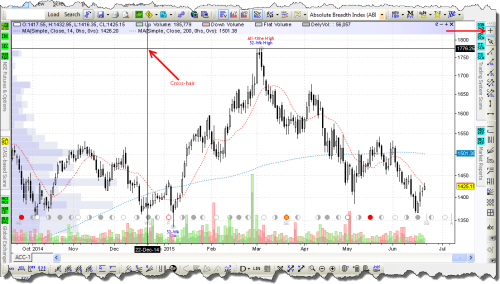
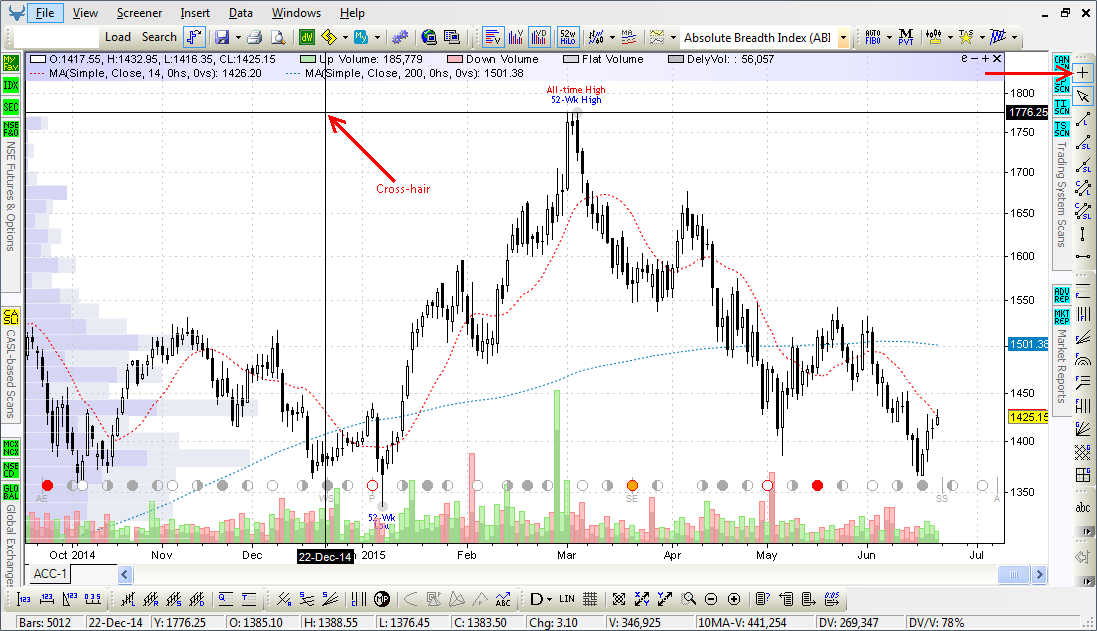
- The Drawing Toolbar in ChartAlert® — besides including the trendline drawing tools discussed above — also includes a Cross-hair feature that can be of great assistance in reading off dates on the x-axis, and/or price levels on the y-axis
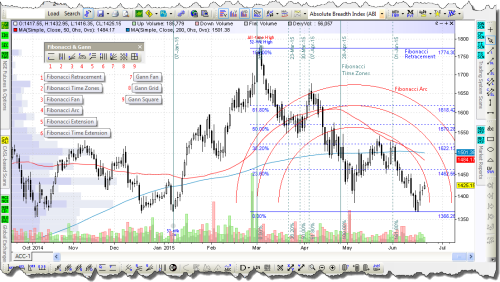
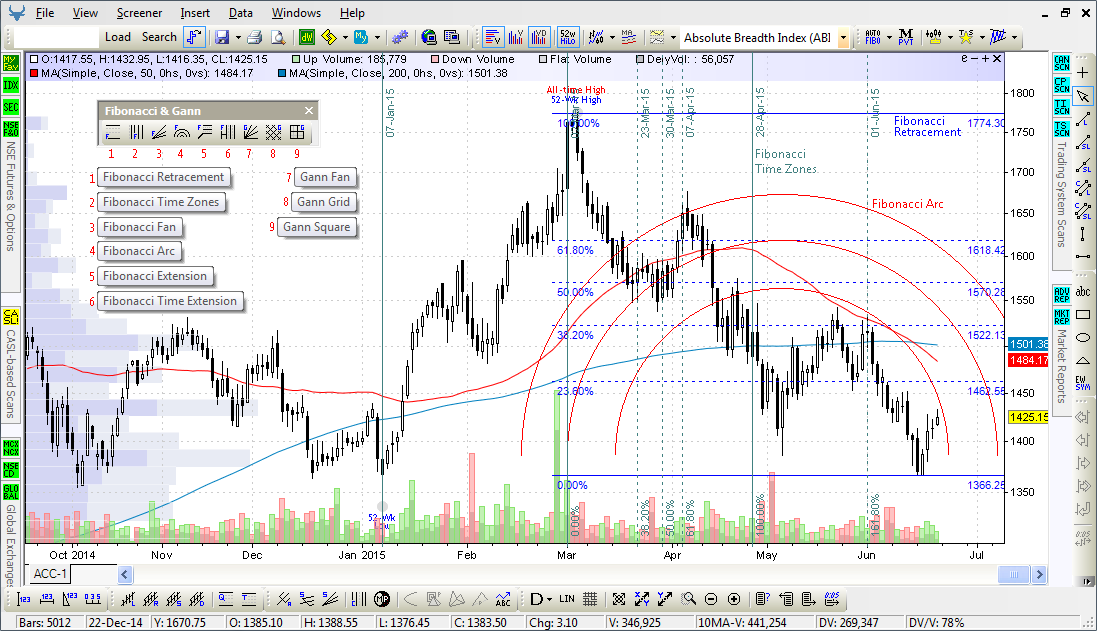
- The Fibonacci and Gann Toolbar in ChartAlert® includes the following analytical features ...
| Fibonacci Retracement | Fibonacci Time Zones | Fibonacci Fan, and Fibonacci Arc |
| Fibonacci Extension, and Fibonacci Time Extension | Gann Fan, Gann Grid, and Gann Square | |
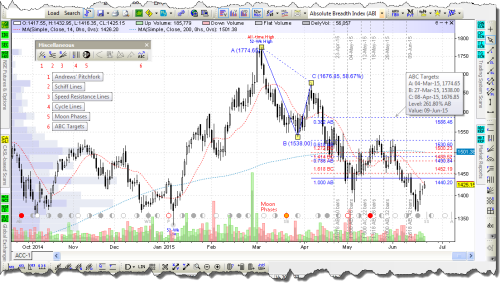
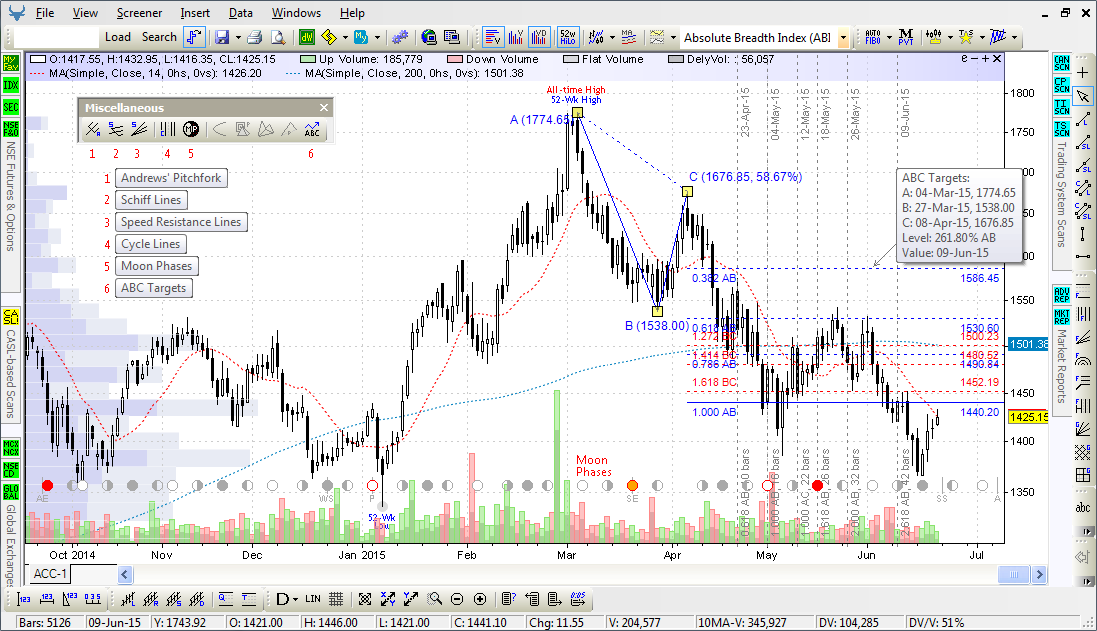
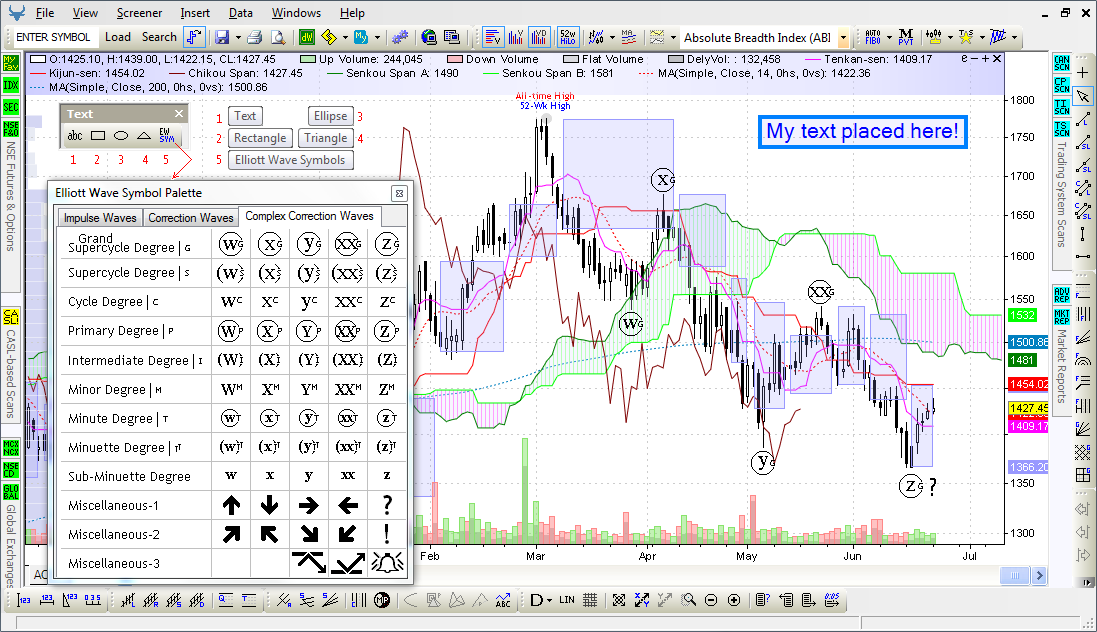
- The Miscellaneous Toolbar in ChartAlert® includes the following analytical features ...
| Andrews' Pitchfork | Schiff Lines | Speed Resistance Lines | Cycle Lines | Moon Phases | ABC Targets |
| Probability Cone | Pyrapoint | Pesavento Patterns | Gartley Patterns |
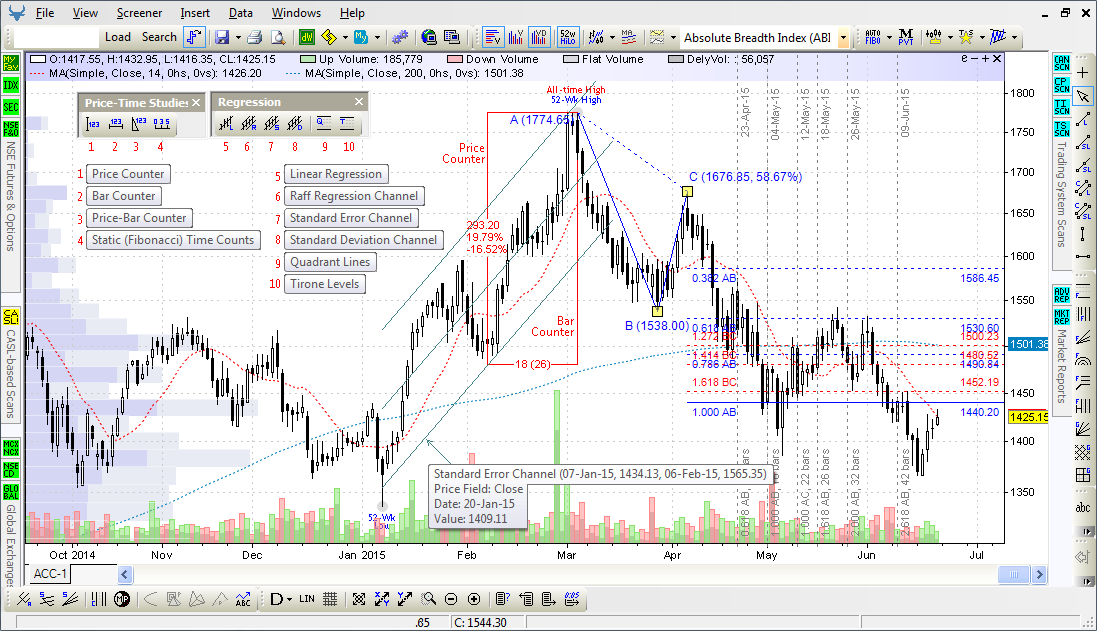
- The Price-Time Studies Toolbar in ChartAlert® includes the following analytical features ...
| Price Counter | Bar Counter | Price-Bar Counter | Static Fibonacci Time Counts |
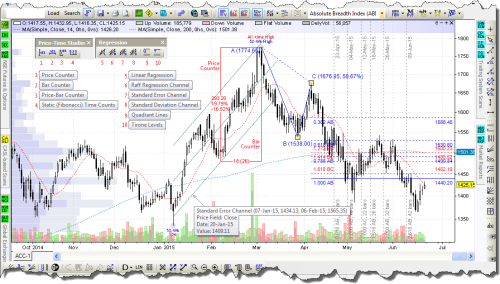
- The Regression Toolbar in ChartAlert® includes the following analytical features ...
| Linear Regression | Raff Regression Channel | Quadrant Lines, and Tirone Levels |
| Standard Error Channel | Standard Deviation Channel |
Advanced Scanner ships with 300+ Functions
— We can add more on demand
You can write your own intricate scans using the following functions: Price/Volume, Calculation, Math, Moving Average, Technical Indicator, Candlestick, Chart Pattern, and Advisory.
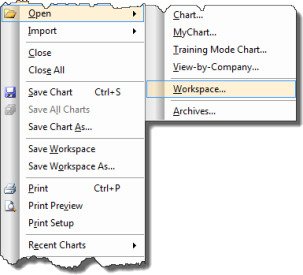
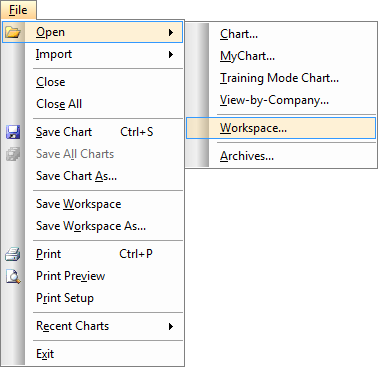
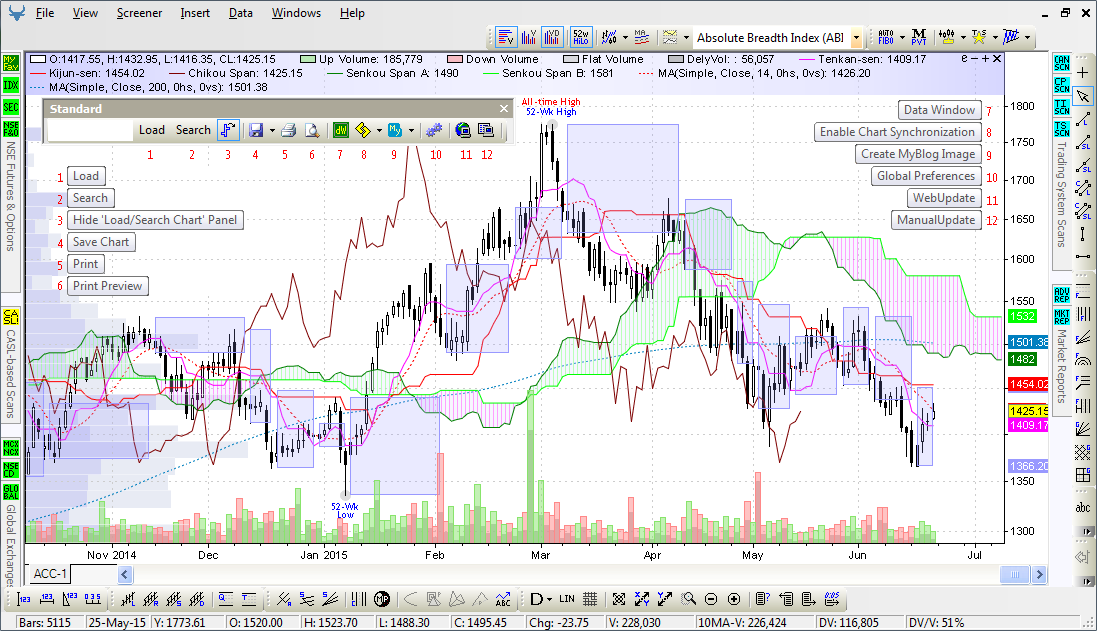
- The Standard Toolbar, that allows you to search for a symbol or open a chart, comes with an elaborate File >> Open dialog
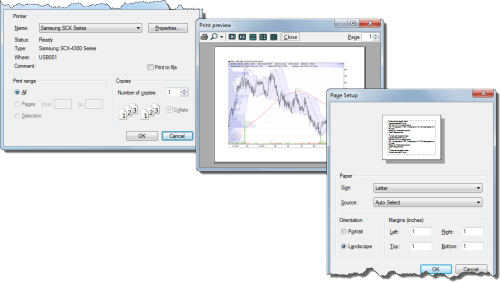
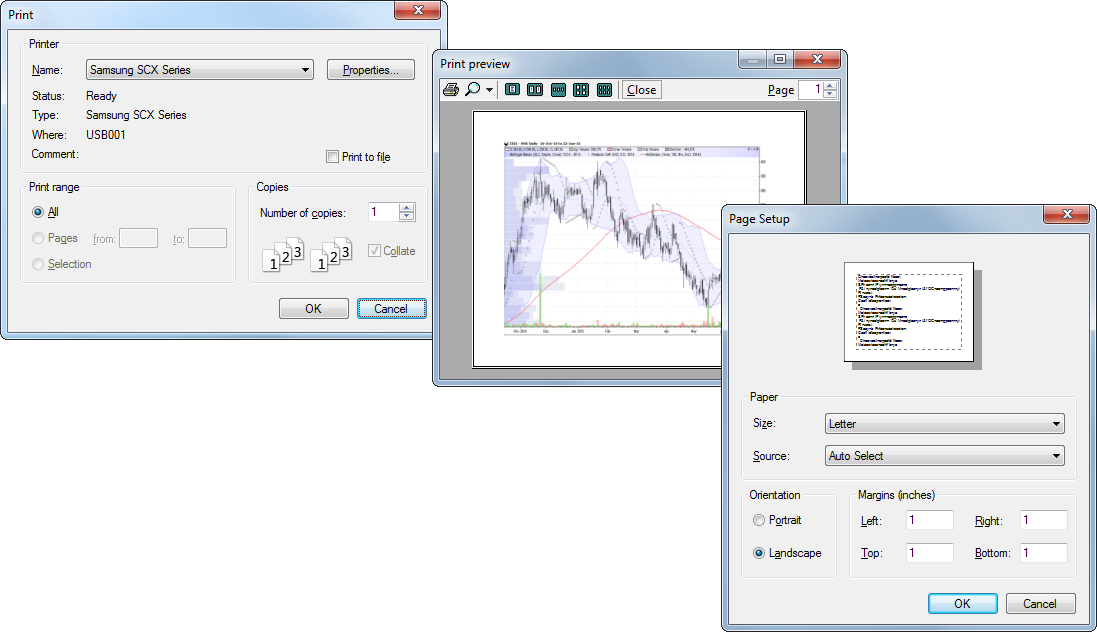
- The Toolbar also lets you print reports and/or charts, and also helps preview before printing
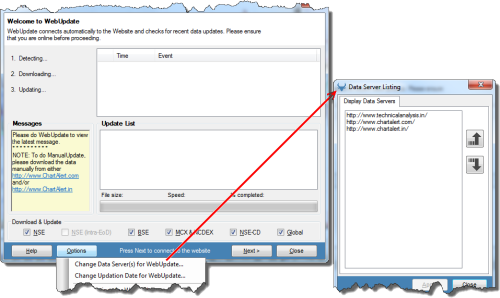
- The Data Collection and Updation process — both WebUpdate and Manual Update — central to keeping the data updated on your computer, can be initiated from this Toolbar
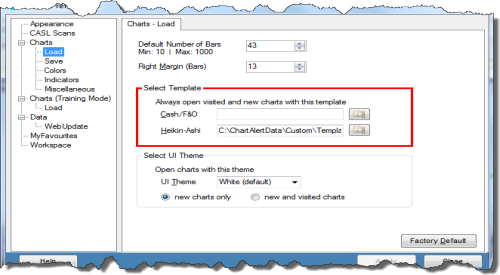
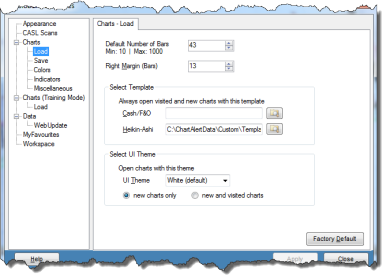
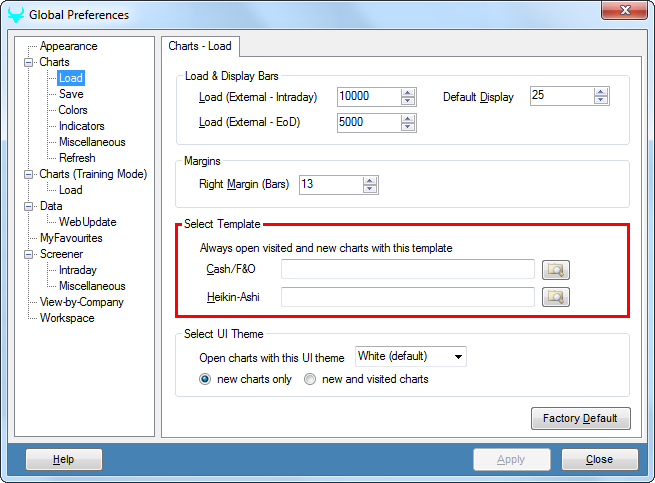
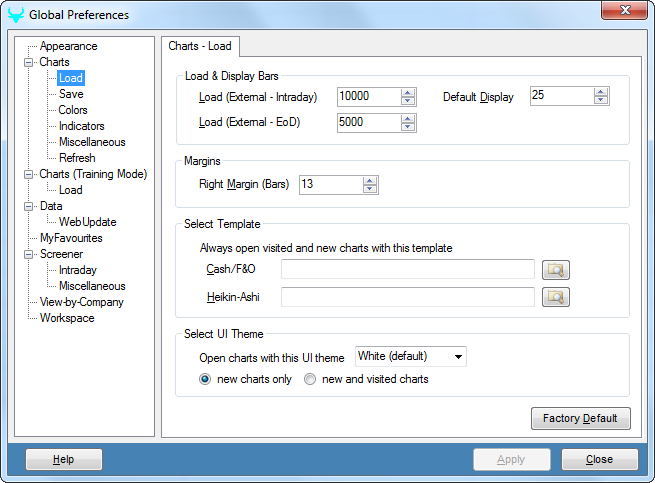
- Since a lot of ChartAlert® features can be customized, the Global Preferences dialog, accessible from this Toolbar, allows you to fully customize the software as per your needs
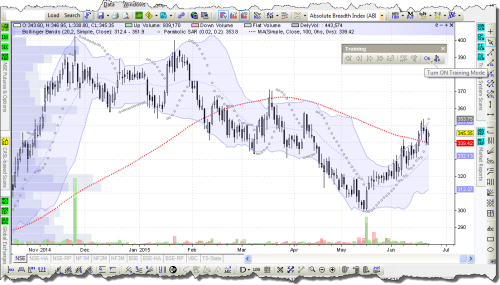
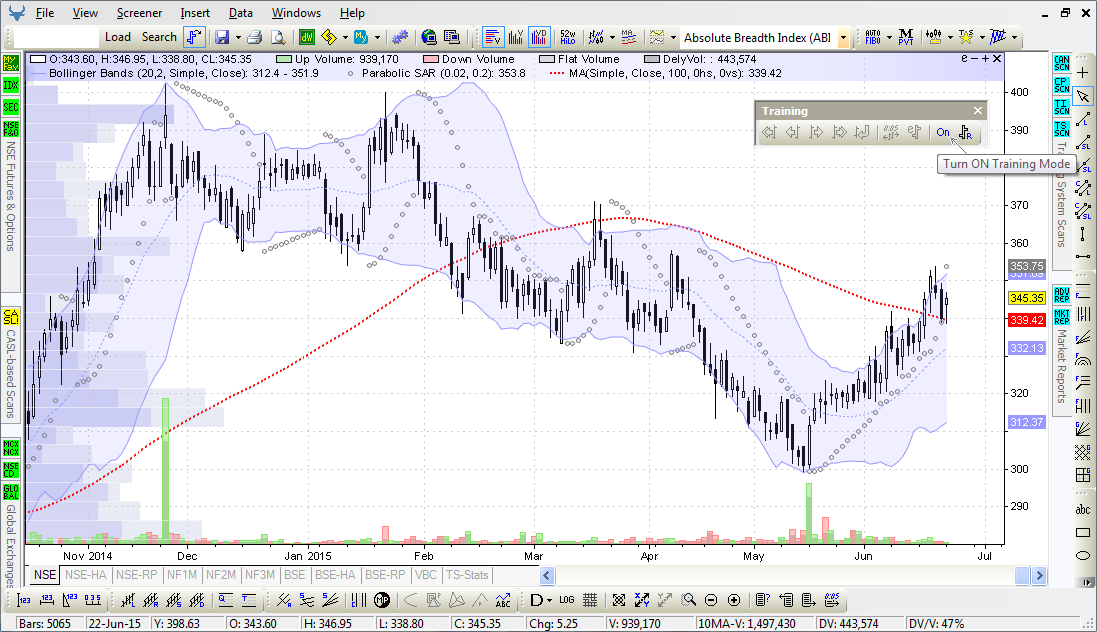
- The Training Toolbar allows you to learn Technical Analysis by training with charts
- In the training mode, you can simulate real-world conditions, by manually adding 1-bar or 5-bars at a time
- In the hands-free mode, an in-built timer allows you to add or remove n-bars at a time
- You can also train with a random chart or a specific chart, at your own pace — that is, you can close a training session and resume again with it after a few days, as ChartAlert® remembers all your training session parameters
- To help learn and train, all Technical Analysis studies remain enabled in the training mode
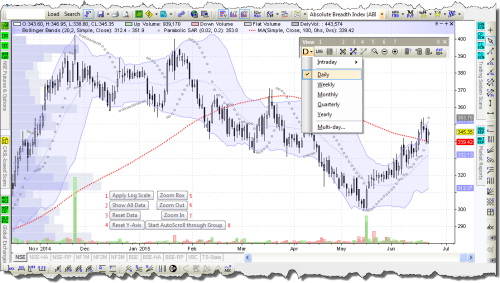
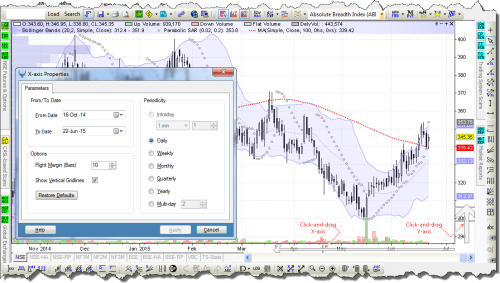
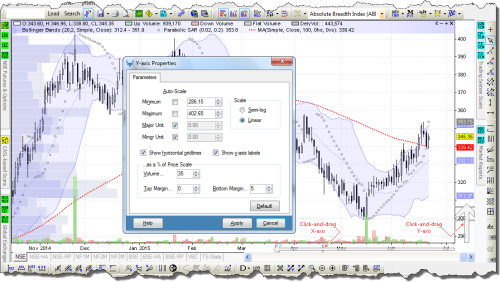
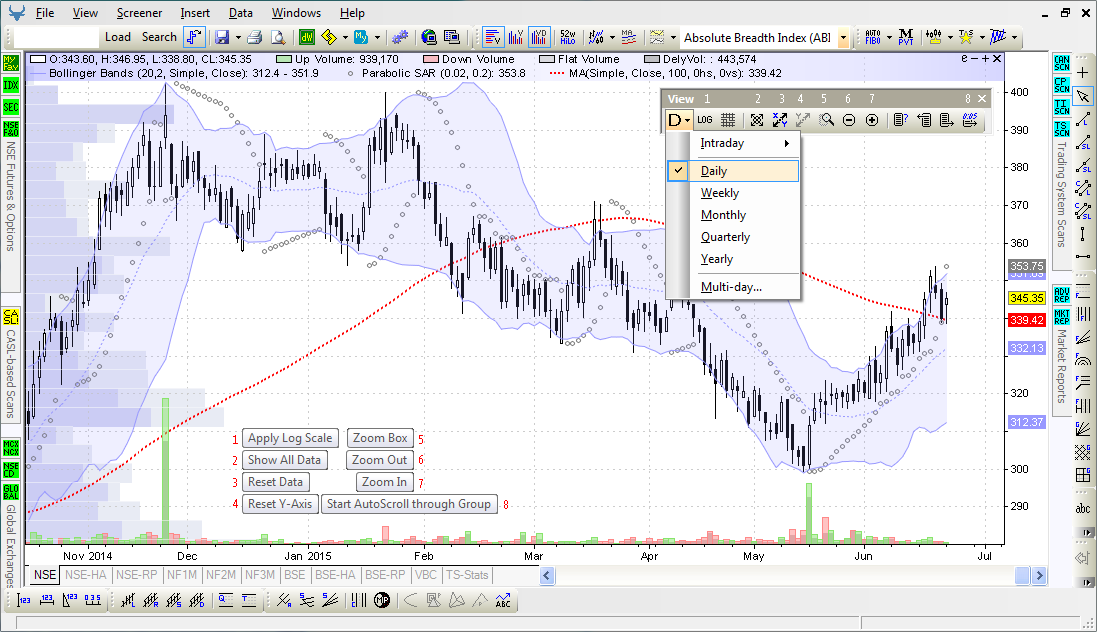
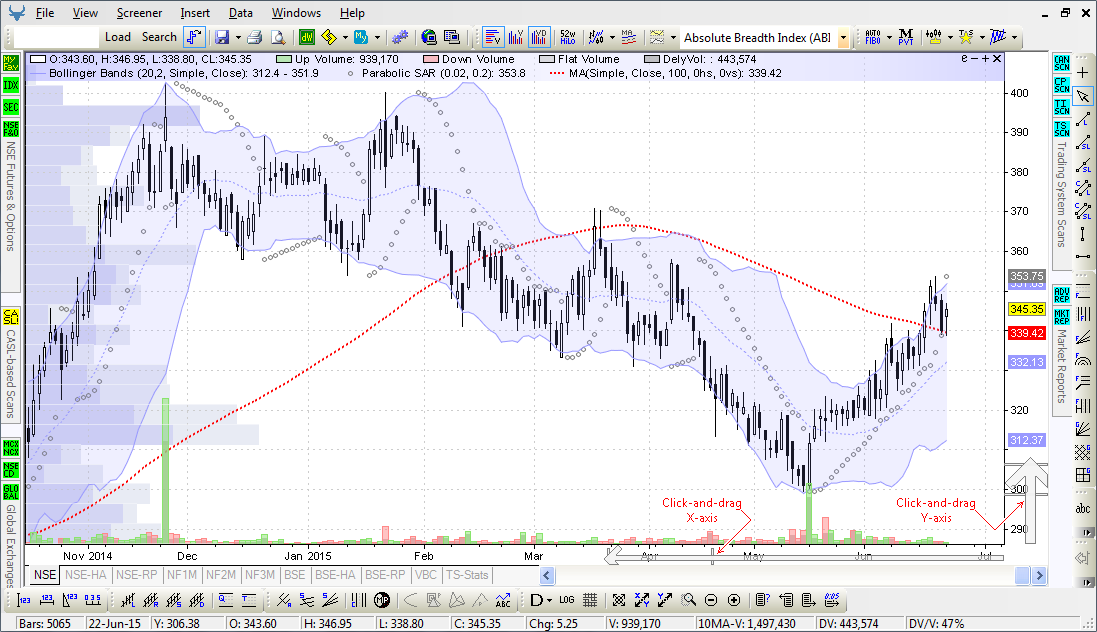
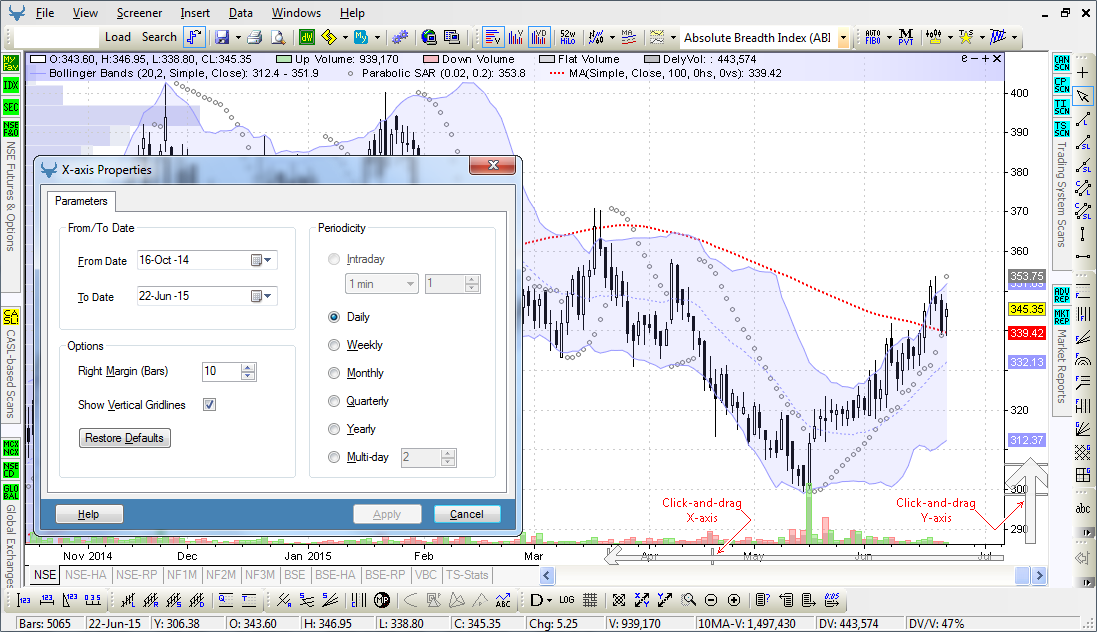
- The View Toolbar in ChartAlert® allows you to see charts in a Daily, Multi-day, Weekly, Monthly, Quarterly and Yearly timeframes **
- With the View Toolbar, you can do all of the following ...
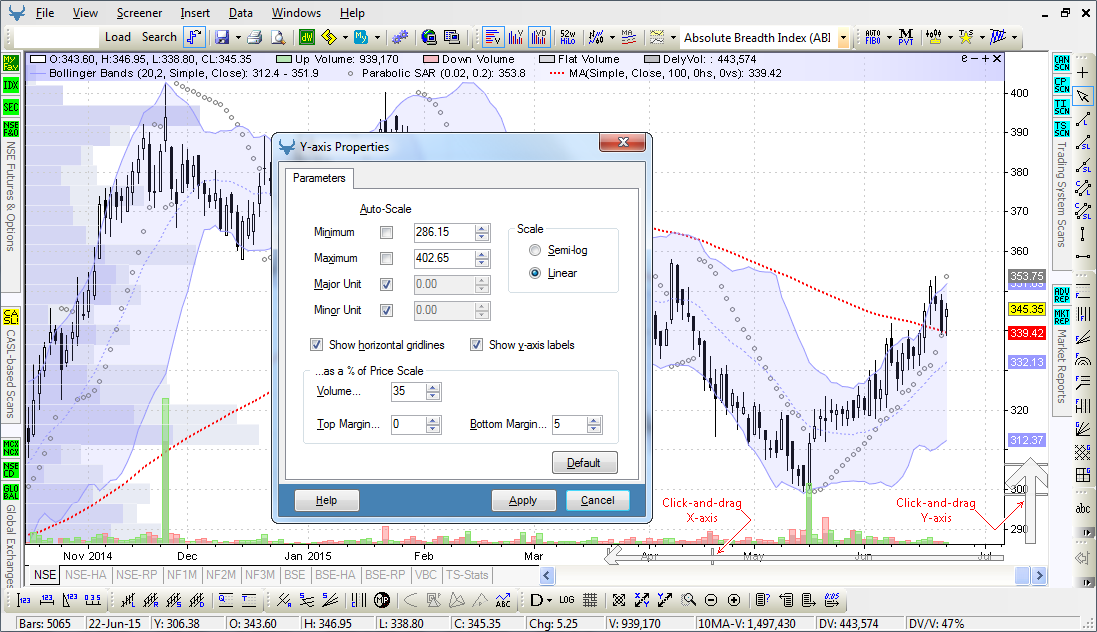
- ... View charts in a Linear or Semi-log scale
- ... Enable or disable gridlines
- ... Zoom-in, Zoom-out or zoom into a specific area using the Zoom Box
- ... See all data from origin, or see a manageable number of bars
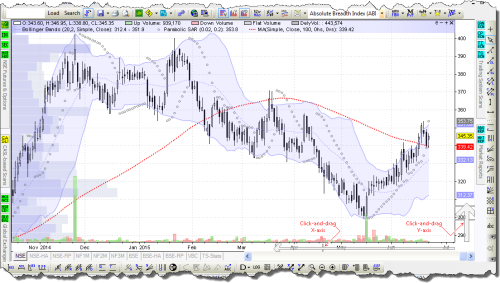
- ... Drag the x-axis and/or y-axis scale to suit your requirements
- ... Set the height of Volume/ Delivery Volume overlay on the price chart
** The future versions will be equipped to read intraday timeframes also
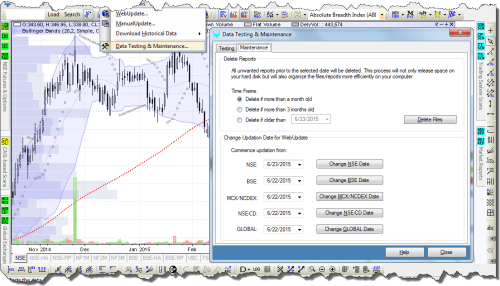
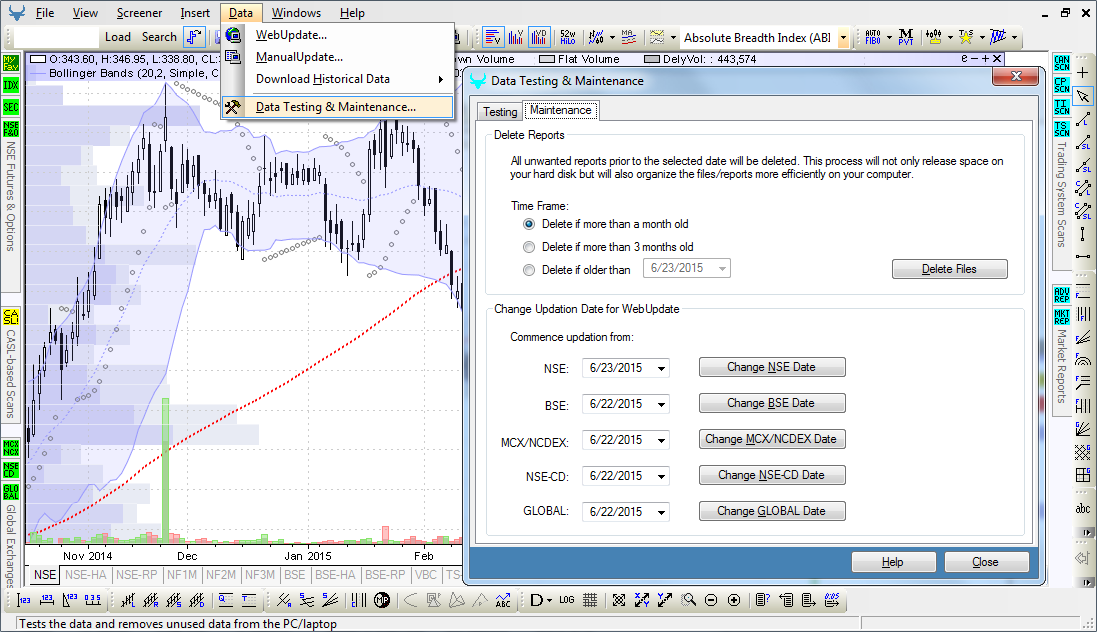
- This feature helps test the data files for true ChartAlert® compatibility and for several different error conditions
- It also helps maintain the data folder by removing those files or reports that may no longer be needed or used by ChartAlert®
- When you run into a data-related snag, the data testing report or the test log file can be emailed to us to diagnose the snag and offer a solution
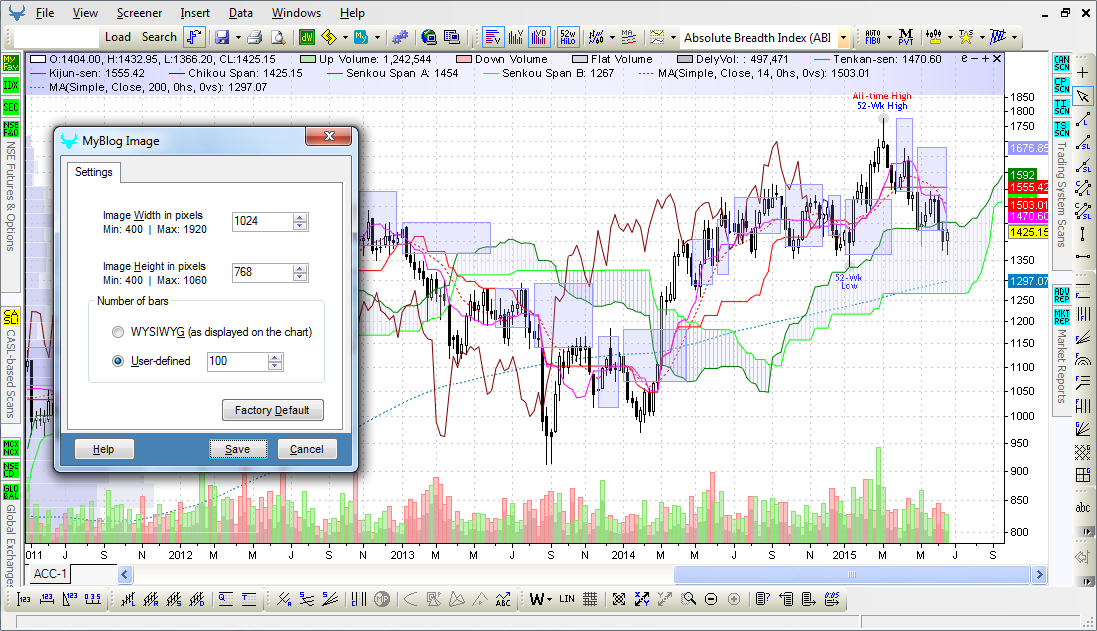
- The printing feature in ChartAlert® allows you to print charts — including all sub-windows loaded in a chart window — to a printer
Basic Scanner — Included with LITE Edition
The menu-driven Basic Scanner will also be included with RTE and PRO Editions in 2015
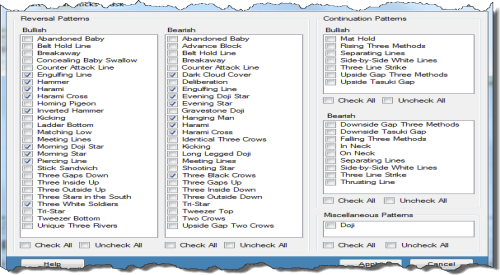
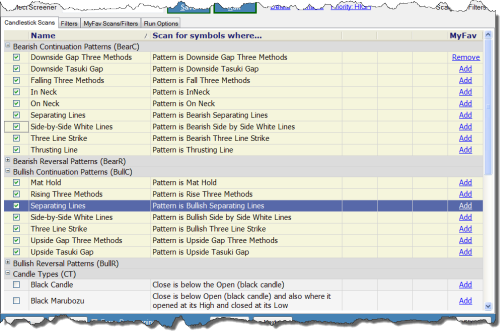
- At the End-of-Day, End-of-Week or End-of-Month, ChartAlert® can scan / screen symbols for the following, based on the in-built pattern detection algorithms ...
- The scan results output is then published in an extremely customizable, and extensively manipulatable, grid report
| Bullish Candlestick Reversal Patterns ... | Bullish Candlestick Continuation Patterns ... | Bearish Candlestick Reversal Patterns ... | Bearish Candlestick Continuation Patterns ... |
| 27 Nos | 7 Nos | 27 Nos | 9 Nos |
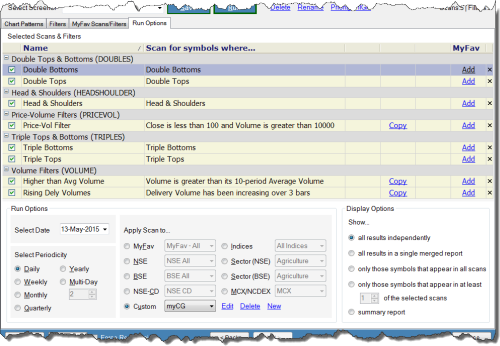
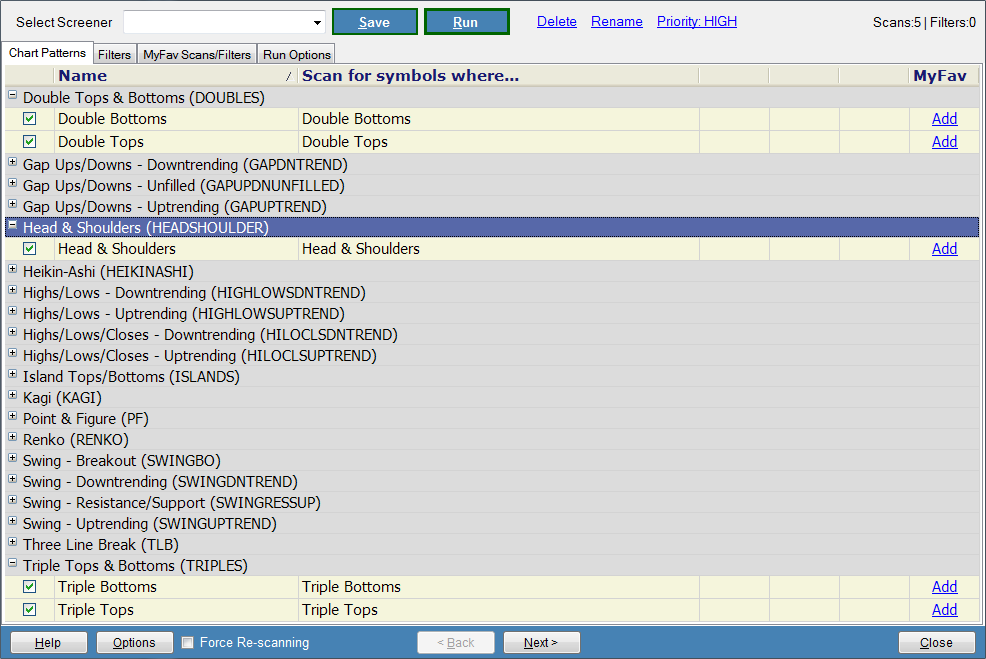
- At the End-of-Day, End-of-Week or End-of-Month, ChartAlert® can scan / screen symbols for the following Chart Patterns, based on the in-built pattern detection algorithms ...
- The scan results output is then published in an extremely customizable, and extensively manipulatable, grid report
| Double Tops | Double Bottoms | Gap Ups | Gap Downs |
| Head & Shoulders | Head & Shoulders — Inverse | Heikin-Ashi | Highs & Lows |
| Island Tops | Island Bottoms | Kagi Chart Type | Point & Figure Chart Type |
| Renko Chart Type | Swings | Three Line Break Chart Type | Triple Tops |
| Triple Bottoms |
More Chart Pattern Scans are coming in the future versions!
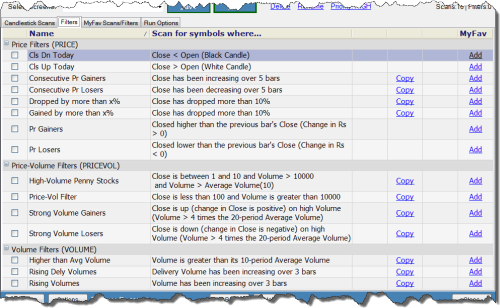
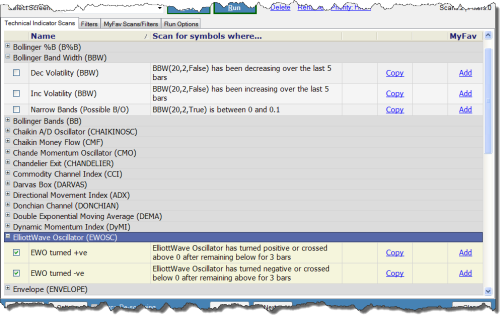
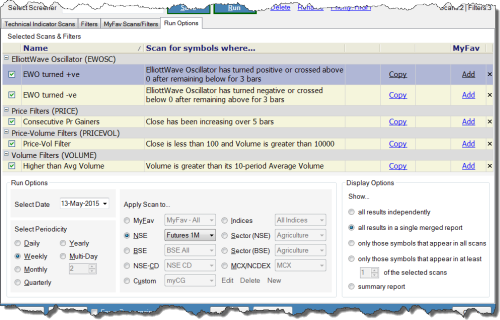
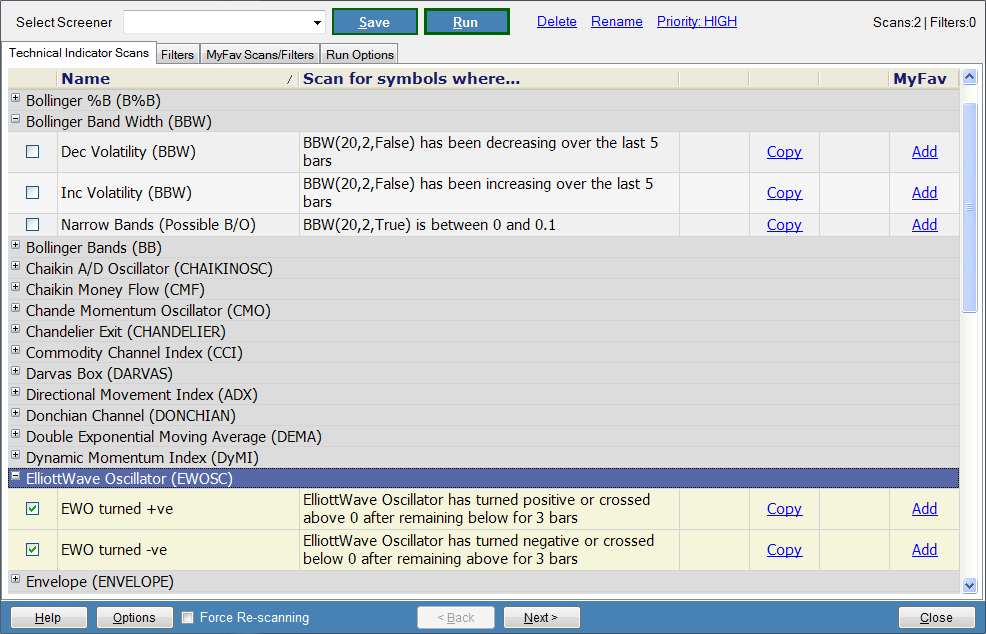
- Technical Indicator Scans are indicator-based algorithms that scan symbols at End-of-Day, End-of-Week or End-of-Month for potential Bullish and/or Bearish signals
- The scan results output is then published in an extremely customizable, and extensively manipulatable, grid report
- The parameters of each of these Scans can be customized and saved by the end-user
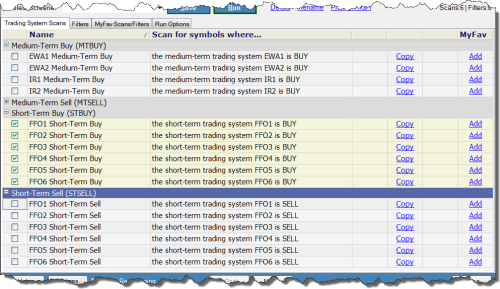
- Trading Systems, a collection of powerful analytical tools that keep you informed about the current technical status of a Symbol, come in short- and medium-term flavours, and are screened and ranked for 50% of NSE's Cash Stocks — these Symbols can be screened for automated Buy and Sell signals
- The scan results output is then published in an extremely customizable, and extensively manipulatable, grid report
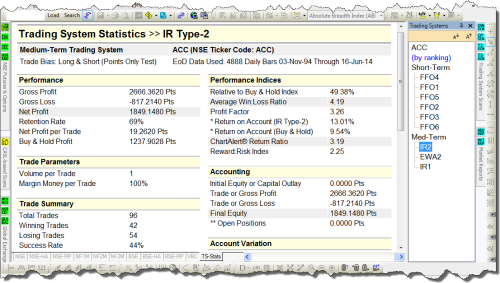
- A typical detailed Trading System Scan includes ...
| Type and Rank of Trading System | Recommendation | Retention Rate |
| Success Rate | Relative to Buy/Hold Index | Average Win-Loss Ratio |
| Profit Factor | Return-on-Account | Risk-Reward Index |
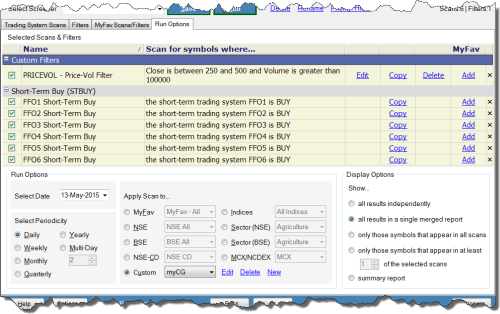
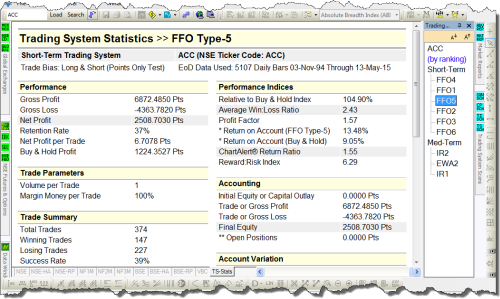
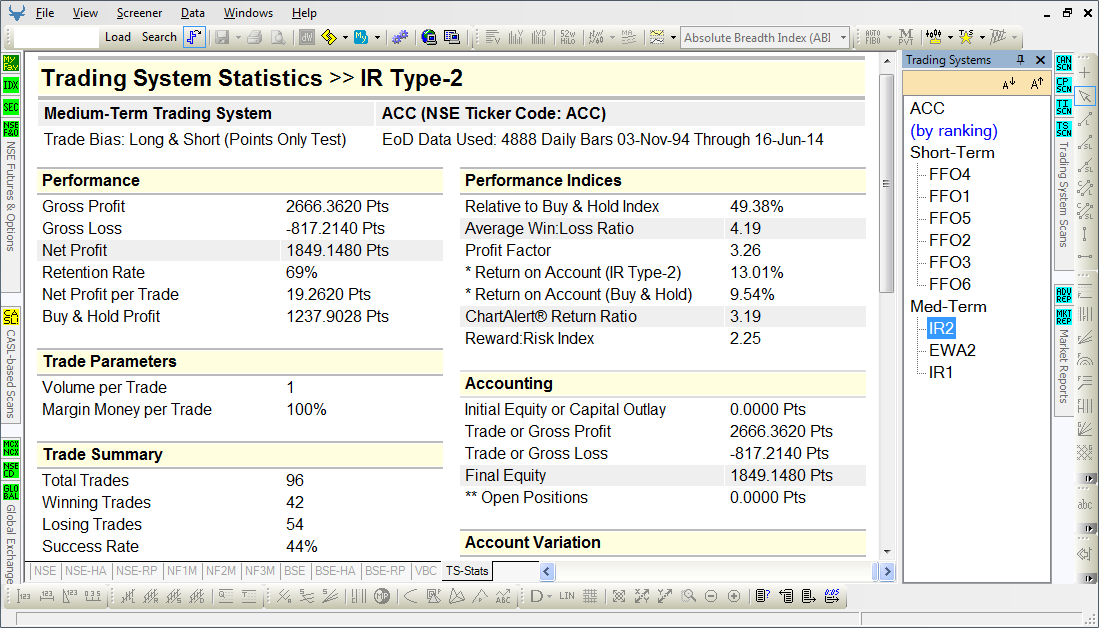
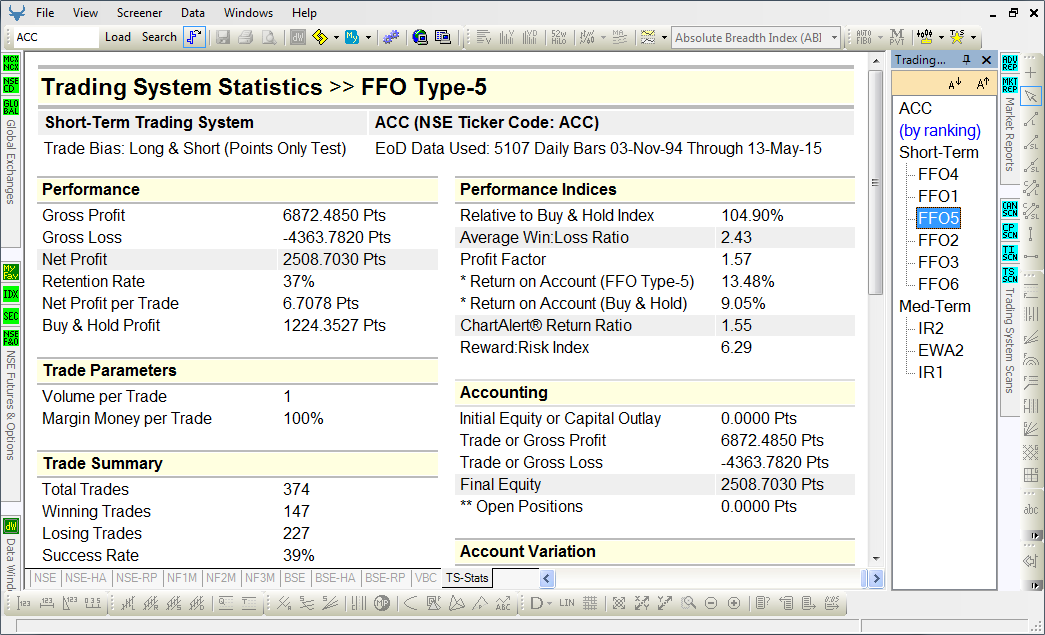
- The Trading Systems Scanner lets you run a detailed Scan at End-of-Day
- The scan results include detailed statistics of automated Buy and Sell signals for an eligible Symbol, from the origin of trading to the present traded day
- The scan results include the following ...
| Gross Profit, and Gross Loss | Net Profit |
| Retention Rate | Winning Trades, and Losing Trades |
| Success Rate | Net Profit per Trade |
| Largest Win per Trade, and Largest Loss per Trade | Average Win per Trade, and Average Loss per Trade |
| Average Win-to-Loss | Maximum Drawdown |
| Profit Factor | Return-on-Account |
| Return Ratio |
Free Software Upgrades
All software upgrades — or future releases — are absolutely free during a subscription period.
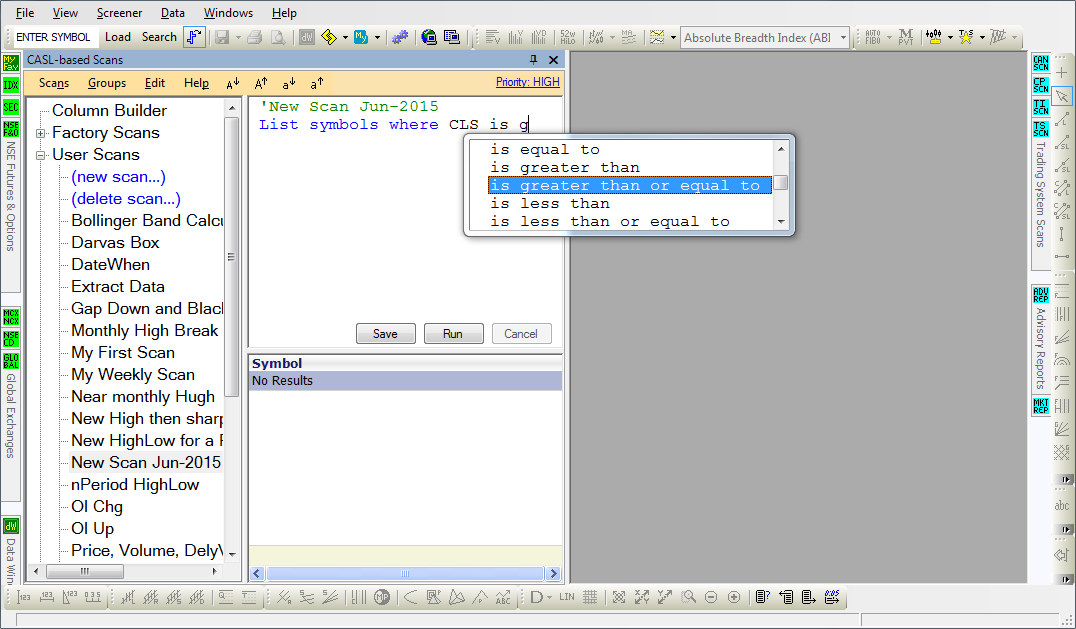
Advanced Scanner — Included with LITE Edition on a complimentary basis
The CASL-based or script-based Advanced Scanner will be included with RTE and PRO Editions in 2015
- ChartAlert® Scripting Language, or CASL, is a text-based powerful scripting language in English, that provides straightforward methods to create Technical Indicator-based and Candlestick-based scanning algorithms to scan stocks and/or commodities for bullish and bearish signals
- The scan results output is then published in an extremely customizable, and extensively manipulatable, grid report
- CASL comes with an in-built Text Editor and/or Prompter, which makes it easy to do the following ...
- ... Modify existing Scans by Re-writing or Re-building
- ... Copy/Edit/Modify/Save existing Factory Scans
- ... Create or Write absolutely New Scans — This is not possible in the Menu-based Basic Scanner
- ... Use numerous ANDing/ORing Conditions
- ... Write and/or Copy/Edit/Modify/Save numerous Filters
- ... Combine multiple Scans
- In the future versions, you will also be able to do the following ...
... Look for Divergence between Price and Technical Indicators— Released in 15.7.1- ... More Chart Patterns — Coming!
- ... Scan on the basis of Fundamental Analysis parameters — Coming!
Friendly Support — We're committed to our Subscribers
Write in if you ever hit a snag in ChartAlert®. We respond to emails in 1 Business Day.
If your requirement is complex, we strive to seek and respond with a solution in 2 Business Days.
Basic Scanner vs Advanced Scanner — Comparison
The Advanced Screener includes ALL the Factory Scans available in the Basic Screener, and more.
The common features, and the major differences, between the Basic Screener and the Advanced Screener are listed below.
| Basic Scanner | Advanced Scanner | |
|---|---|---|
| Menu-driven Interface | Script-based Interface, where the end-user can write/ re-write scans using the scripting language | |
| ... Ships with several Factory Scans ... | ||
| ... Factory Scans can be copied by end-user, and the parameters of the scan can be modified for re-use ... | ||
| New scans cannot be created | New scans can be written using the scripting language | |
| Complex scan algorithms cannot be created | Complex scan algorithms can be created using the scripting language | |
| Scans cannot be run across segments — that is, Candlestick/ Techinical Indicator/ Other scan algorithms cannot be combined and run | Scans can be run across segments — that is, Candlestick/ Techinical Indicator/ Other scan algorithms can be combined and run | |
|
Basic Scanner is included with LITE Edition
Advanced Scanner is included with LITE Edition on a complimentary basis Basic Scanner and Advanced Scanner will be included with RTE and PRO Editions in 2015 |
||
Scan #1
-
List symbols where Close is between 100 and 200
Or Close < 10
Or Volume > 100000
And Close has crossed above SMA(21)
And Volume > Average Volume(10)
Add Column Volume as VOL
Sort on Column VOL desc
Add Column SMA(21)
Apply to Nifty
Apply to NSE Futures 1M
Apply to Junior
Apply to MyFav List1
Apply to MyFav List2
Set periodicity to Weekly
-
This Scan will list the following Symbols:
- where the current Close is between 100 and 200
- where the current Close is less than 10
- where the traded Volume is more than 100,000
- where the current Volume is more than the 10-bar average of the daily traded Volume
- where the current Close has just crossed above its 21-bar Simple Moving Average (SMA)
The Scan report will also include a 21-bar Simple Moving Average (SMA) column as SMA(21).
The Scan will be applied to all Symbols that constitute the Nifty and Junior indices, and it will also be applied to all 1-mo NSE Futures, and MyFavourite watchlists titled "List1" and "List2".
Furthermore, the Scan will be applied to Weekly (and not Daily) data.
Examples of Scans possible in the Advanced Scanner
Scan #2
-
List symbols where Delivery Volume has been increasing over 5 bars
Apply to Nifty
-
This Scan will list all those Nifty Symbols where the Delivery Volume has been increasing over the last 5 trading bars. The lookback period for this Scan would (therefore) be the last 6 trading bars.
Examples of Scans possible in the Advanced Scanner
Scan #3
-
List symbols where RSI(14) has been falling over 5 bars
Apply to NSE
-
This Scan will list all those NSE Symbols where the 14-bar Relative Strength Index (RSI) has been decreasing (or falling) over the last 5 trading bars. The lookback period for this Scan would (therefore) be the last 6 trading bars.
Examples of Scans possible in the Advanced Scanner
Scan #4
-
List symbols where Close has gained by more than 10%
Apply to NSE
-
This Scan will list all those NSE Symbols where the current Close has gained by more than 10% vis-a-vis the previous Close. The lookback period for this Scan would (therefore) be the last 2 trading bars.
Examples of Scans possible in the Advanced Scanner
Scan #5
-
List symbols where EMA(14) has crossed above EMA(21)
Add Col EMA(14)
Add Col EMA(21)
Apply to NSE
-
This Scan will list all those NSE Symbols where the 14-bar Exponential Moving Average (EMA) has just crossed above its 21-bar Exponential Moving Average (EMA).
The Scan report will also list two columns viz. 14-bar EMA as "EMA(14)", and 21-bar EMA as "EMA(21)".
Examples of Scans possible in the Advanced Scanner
Scan #6
-
List symbols where Close a bar ago crossed below EMA(21) a bar ago
And Close < EMA(21)
Apply to NSE
-
This Scan will list all those NSE Symbols where yesterday's Close (1-bar ago) had crossed below yesterday's 21-bar Exponential Moving Average (1-bar ago), and where today's Close is below today's 21-bar EMA.
Examples of Scans possible in the Advanced Scanner
Scan #7
-
List symbols where Close has crossed below EMA(21) after remaining above it for 3 bars
Apply to NSE
-
This Scan will list all those NSE Symbols where today's Close has just crossed below today's 21-bar Exponential Moving Average (EMA), provided the Close of the previous 3 trading bars had been above the 21-bar EMA of the previous 3 trading bars.
The lookback period for this Scan would (therefore) be the last 4 trading bars.
Examples of Scans possible in the Advanced Scanner
Scan #8
-
List symbols where Close is above Open for the last 3 bars
Apply to NSE
-
This Scan will list all those NSE Symbols where the Close of all the last 3 trading bars has been above the Open of all the last 3 trading bars (respectively).
The lookback period for this Scan would (therefore) be the last 3 trading bars.
Examples of Scans possible in the Advanced Scanner
Scan #9
-
List symbols where Close < (EMA(14) + 2% of EMA(14))
Apply to NSE
-
This Scan will compute 2% of the value of a 14-bar Exponential Moving Average (EMA) and add it to the value of the 14-bar EMA; let's say this computed value is "N".
The Scan will then list all those NSE Symbols where the current/ today's Close is below the computed value viz. "N".
Examples of Scans possible in the Advanced Scanner
Scan #10
-
List symbols where Price is touching Envelope Upper(200,2,EMA)
Apply to NSE
-
This Scan will list all those NSE Symbols where the current trading bar has traded the Upper band of the 200-bar Envelope (the other parameters for computing the Envelope being 2% and EMA).
Examples of Scans possible in the Advanced Scanner
Scan #11
-
List symbols where Close is near BBU(20)
And Close < BBU(20)
Apply to NSE
-
This Scan will list all those NSE Symbols where the current Close is "near" or just a shade away from the Upper band of the 20-bar Bollinger Band, and where all those NSE Symbols have closed below that Upper Bollinger Band.
Examples of Scans possible in the Advanced Scanner
Scan #12
-
List symbols where Close is between BBL(20) and 2% above BBL(20)
Add Column Close
Add Column BBL(20) as BBL
Apply to NSE
-
This Scan will list all those NSE Symbols where the current Close is between the Lower band of the 20-bar Bollinger Band and a value that is 2% above that Lower Bollinger Band.
The Scan report will also list two columns viz. "Close", and 20-bar Bollinger Band Lower as "BBL".
Examples of Scans possible in the Advanced Scanner
Scan #13
-
List symbols where BBU(20) has been converging towards BBL(20) for the last 5 bars
Apply to NSE
-
This Scan will list all those NSE Symbols where the Upper band of the 20-bar Bollinger Band has been converging or moving towards its Lower band for all of the last 5 trading bars.
The lookback period for this Scan would (therefore) be the last 5 trading bars.
Examples of Scans possible in the Advanced Scanner
Scan #14
-
List symbols where pattern is Renko Black for the last 3 bars
Apply to Nifty
Set Chart Type to Renko
-
This Scan will first change the chart data to Renko, and then scan and list all those Nifty Symbols where the last 3 Renko blocks are black (i.e. downtrending) in color. The lookback period for this Scan would (therefore) be the last 3 trading blocks.
Examples of Scans possible in the Advanced Scanner
Scan #15
-
List symbols where pattern is PF O to X
Apply to Nifty
Set Chart Type to PF(10% of Close, 3, Close)
-
This Scan will first change the chart data to Point & Figure, and then scan and list all those Nifty Symbols where the Point & Figure pattern has just changed from O to X (i.e. reversed from downtrending to uptrending).
The Point & Figure parameters used for the Scan are: Box Size is 10% of Close, Reversal Amount is 3 Box Sizes, and the Price Field is Close.
Examples of Scans possible in the Advanced Scanner
Scan #16
-
List symbols
Add Column BarsSince(pattern is new High) as XBars
Add Column Highest Value Since(Close has crossed above EMA(200), Close) as CloseSinceXover
Apply to Nifty
-
This Scan will list the number of trading bars that have passed since a Symbol registered a new High, under a column header titled "XBars".
This Scan will also list the Highest Value of Close that has been registered by a Symbol, under a column header titled "CloseSinceXover", since a particular event happened. In this case, the event is Close having crossed above its 200-bar Exponential Moving Average (EMA).
The Scan will be applied to all Nifty Symbols.
Examples of Scans possible in the Advanced Scanner
Scan #17
-
List symbols where pattern is HAshiRed for the last 3 bars and pattern is HAshiGreen 3 bars ago
Apply to NSE
-
This Scan will list all those NSE Symbols where the last 3 Heikin-Ashi trading bars were Red in color (downtrending), but the previous 3 Heikin-Ashi trading bars (before the Red bars) were Green in color (uptrending). The lookback period for this Scan would (therefore) be the last 6 Heikin-Ashi bars.
Examples of Scans possible in the Advanced Scanner
Scan #18
-
List symbols where pattern is New High(High,52,w) for 3 bars
Apply to NSE
-
This Scan will list all those NSE Symbols where a New High has been registered for 3 consecutive trading bars. The New High is defined as a 52-week High.
The lookback period for this Scan would (therefore) be the last 3 trading bars.
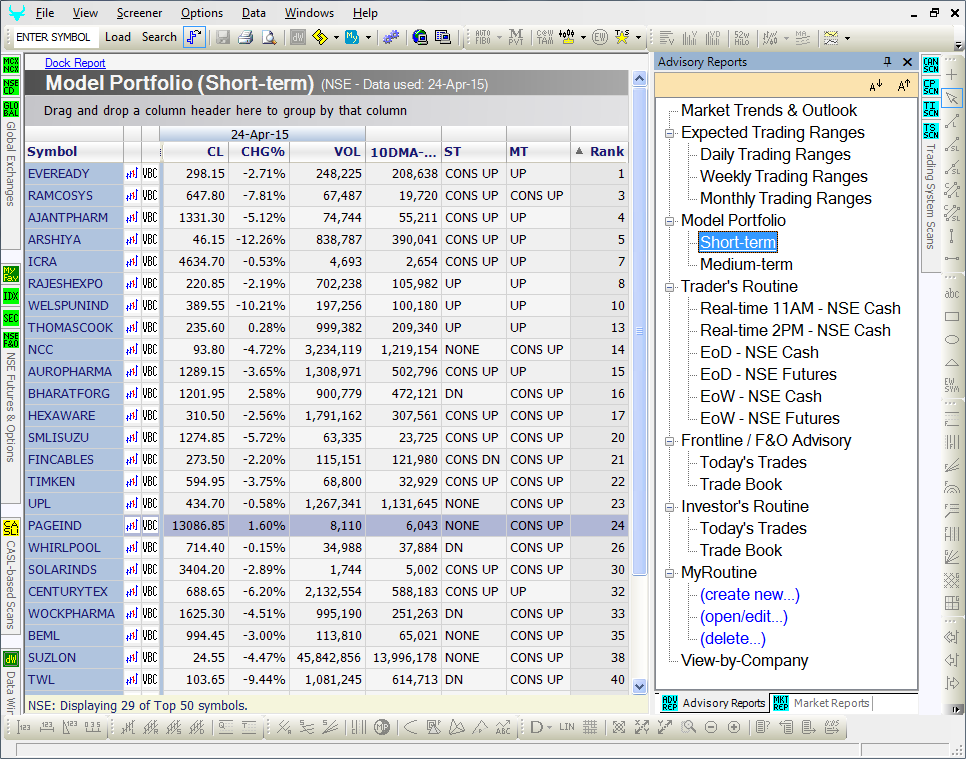
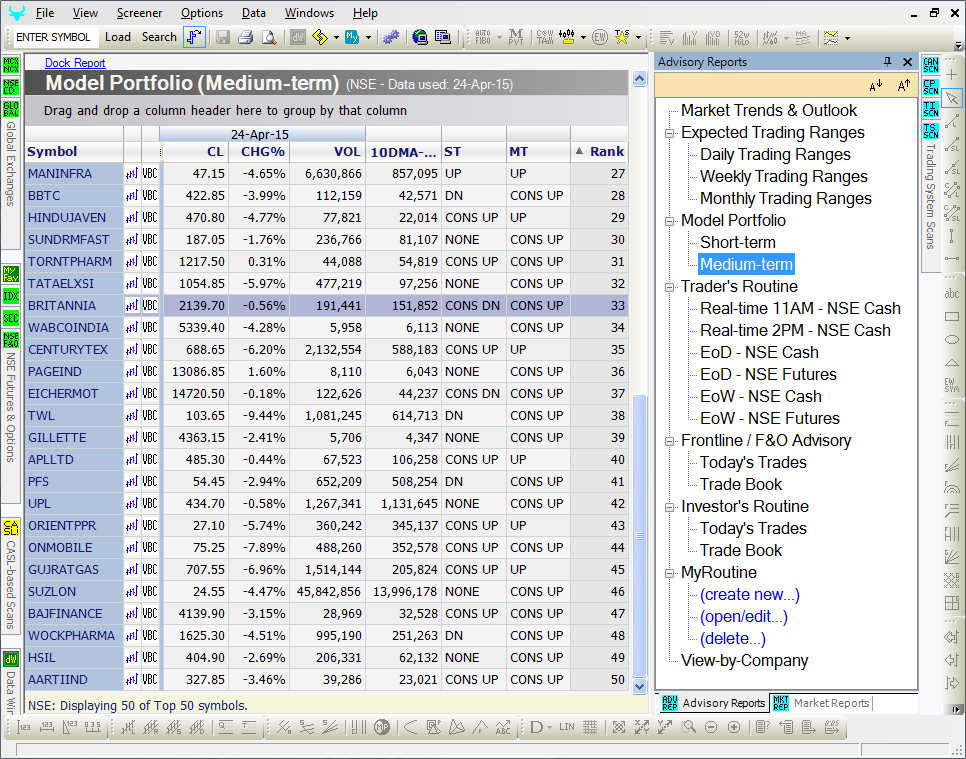
Market Information and Prospecting Reports
— Included with LITE Edition on a complimentary basis
The Market Information / Prospecting Reports will be included with PRO Edition in 2015
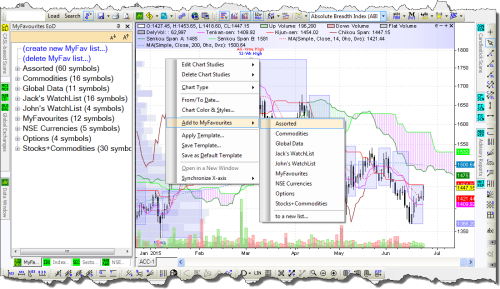
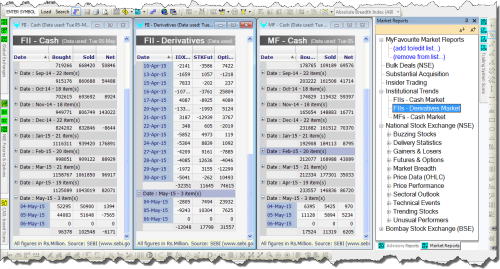
- To help you avoid wading through tons of reports available under the Market Reports section everyday, and to help save time looking for the same report everyday, ChartAlert® allows you to browse through and group your Market Reports as MyFavourite Reports in the LHS Navigation Panel, from where you can then quickly access these reports in a jiffy
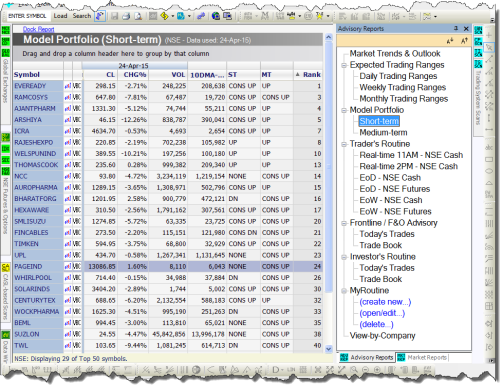
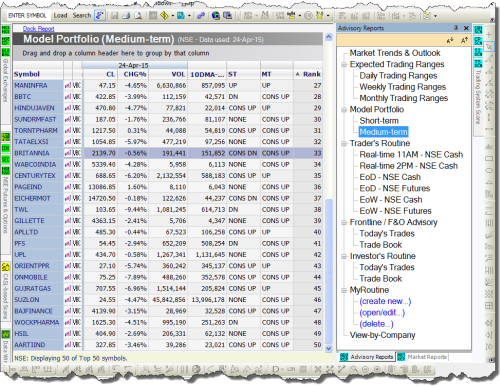
- A snapshot report of the trading day's activity, it includes Market Commentary, Nifty daily Chart, Indices activity, Advances/ Declines, Deliveries, FII/ MF Trends, Gainers & Losers, Most Active Stocks, 5-day Price/ Volume/ Delivery Trends, 5-day and 22-day Buzzing Stocks, Short-/ Medium-term Model Portfolio, Top Sectoral Trends, etc
- A template designed for 150+ NSE F&O symbols, including the Nifty Components, displays Short-, Medium- and Long-term Trendlines, Price Channels, and important Supports/ Resistances as an overlay on the chart
- This Technical Analysis C@W Report displays those Supports and Resistances in a printable grid format report
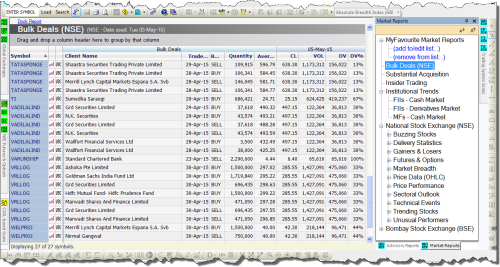
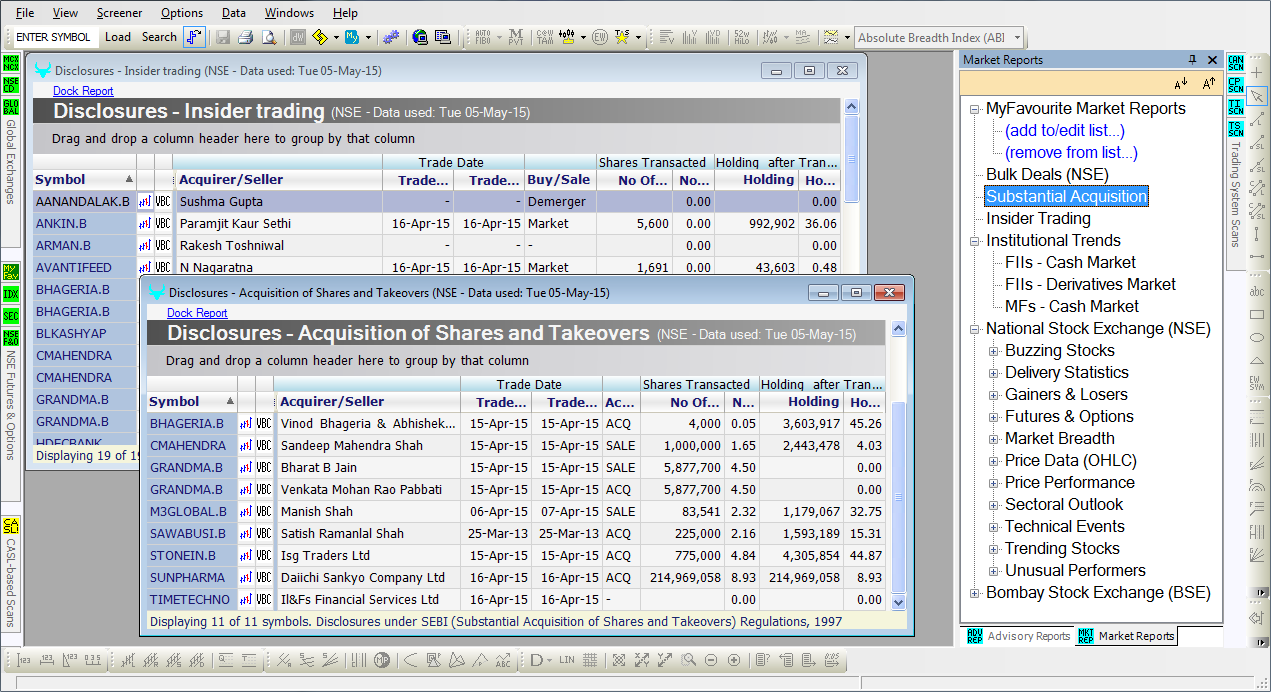
- This Market Report includes a list of symbols that were transacted as Bulk or Block Deals on the National Stock Exchange (NSE)
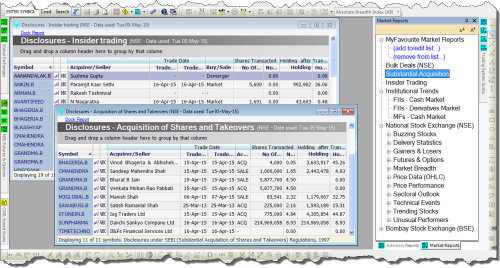
- This Market Report, published by SEBI, includes the Substantial Acquisition and Insider Trading activity of the current trading day
- This Market Report includes the 12-mo trend of Institutional trades (FIIs and MFs) in the Cash and Futures segment of the stock market
Fully Customizable
All features in ChartAlert® are fully customizable with just a left-and-right-click of a mouse.
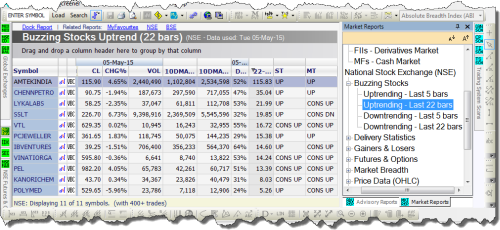
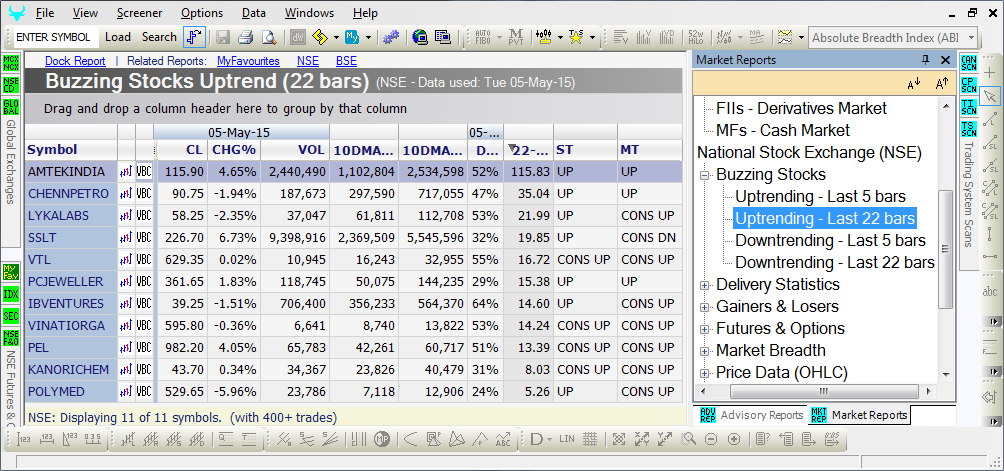
- This Market Report includes a list of Stocks "buzzing" over the last Week or Month as of a given trading day
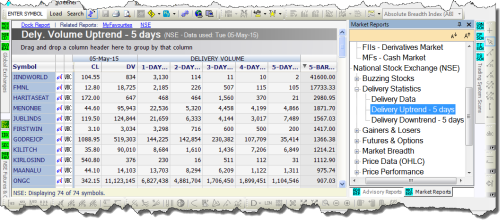
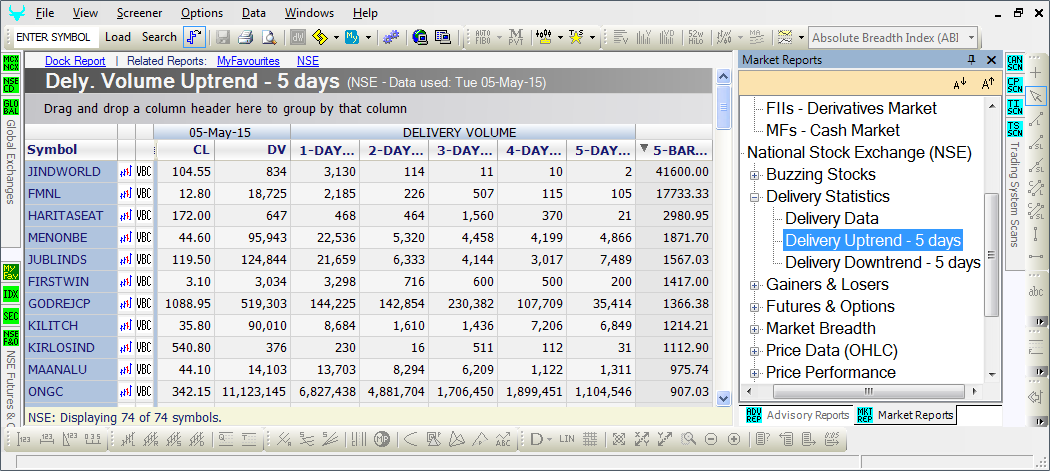
- This Market Report includes Delivery Statistics of all NSE Cash Stocks for the current trading day
- It also includes a list of symbols whose Delivery Volumes — number of shares marked for Deliveries during a trading day — are in an uptrend/ downtrend currently
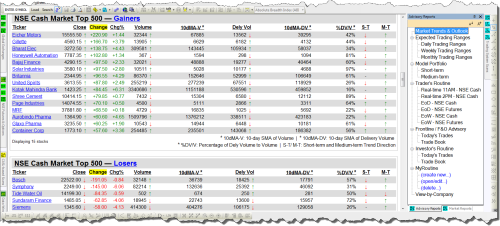
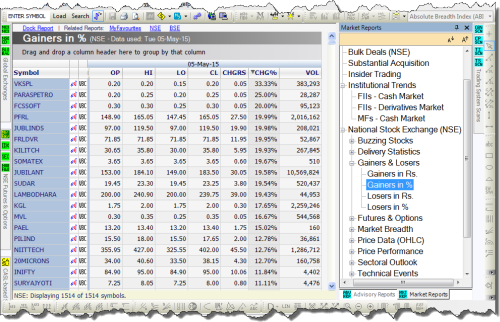
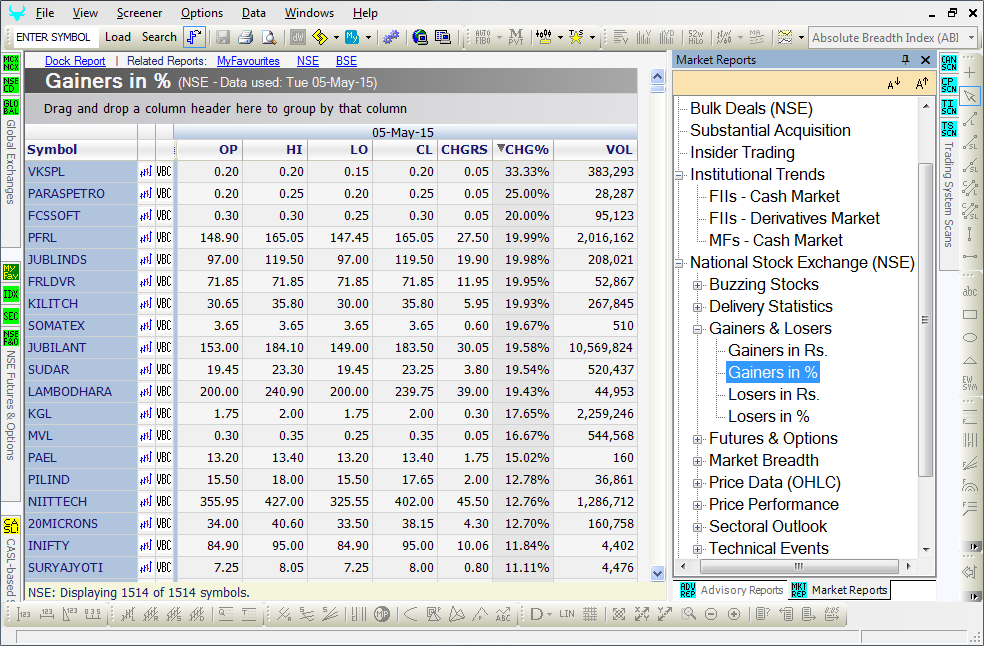
- This Market Report displays symbols that have gained or lost during the trading day vis-a-vis the previous trading day
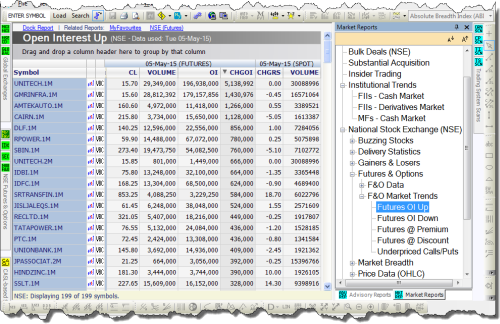
- This group of Market Reports includes all price data/ information of all 1-mo Derivatives for the current trading day
- The coverage is categorized as follows ...
- The F&O Market Trends group includes the following value-added reports ...
| Futures | Options | Most Active Futures | Active Calls | Active Puts | Put/Call Ratio |
| Futures Open Interest Up/Down | Futures at Premium/Discount | Underpriced Call/Put Options |
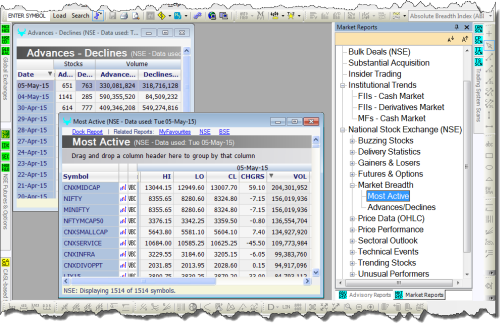
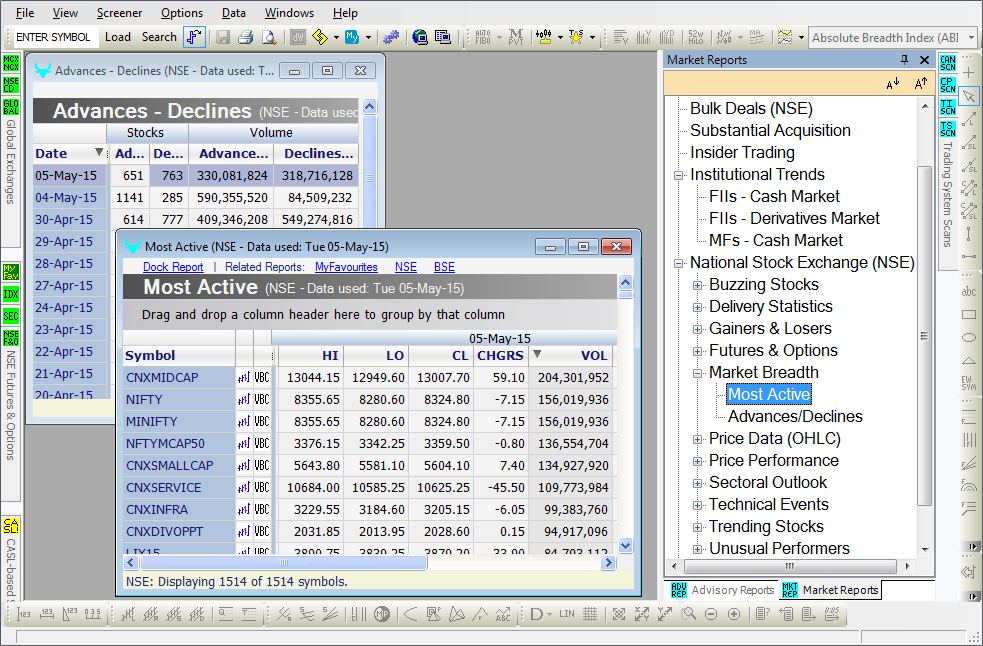
- This includes the Most Active, and the Advances/ Declines reports
- The Most Active report displays symbols ordered by Volume traded during the trading day
- The Advances/ Declines report displays the total number of symbols that were traded on the National Stock Exchange (NSE)
- It also shows the number of securities that gained or lost (advances/ declines) in terms of Indian Rupees
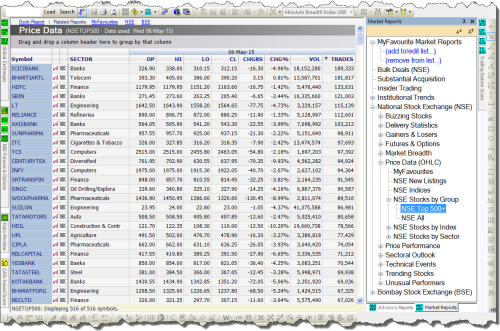
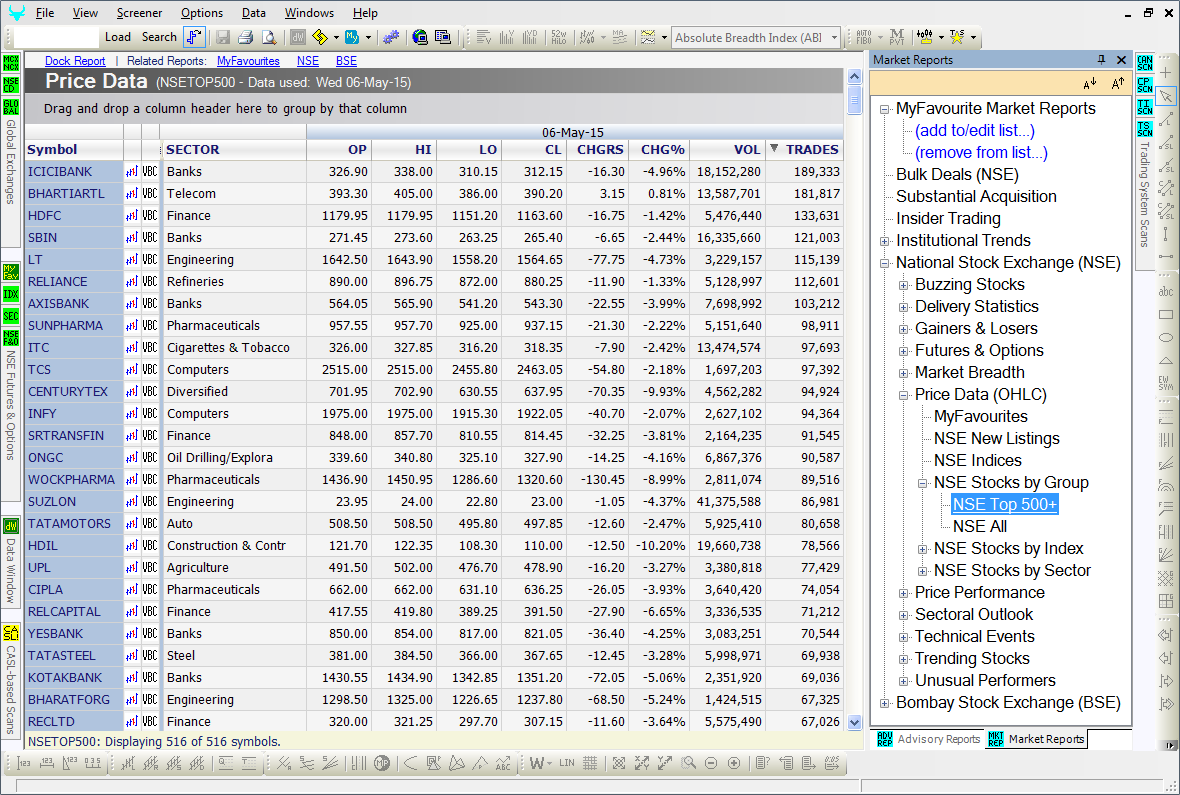
- This group of Market Reports includes all price data/ information of all symbols for the current trading day
- The coverage is categorized under ...
- ... MyFavourites
- ... NSE Indices, and BSE Indices
- ... NSE new listings, and BSE new listings
- ... NSE Top 500+, and BSE Group-A
- ... NSE All, and BSE All
- ... NSE Stocks by Indices, and BSE Stocks by Indices
- ... NSE Stocks by Sector, and BSE Stocks by Sector
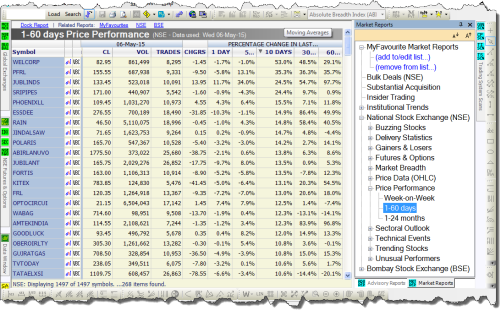
- This Market Report compares the latest prices of symbols marked to their previous trading Week's prices, and to previous prices varying over a period of 1 Day, 5 Days, 10 Days, 30 Days, 60 Days, 1 Month, 3 Months, 6 Months, 12 Months and 24 Months, to get a perspective of how the symbols have been trending over the said period
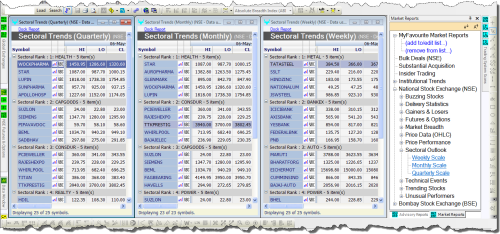
- This Market Report publishes the 5 top performing Sectors, and 5 top performing Stocks within those top performing Sectors, over a Weekly, Monthly and Quarterly period
Multi-threaded and Fast
Multi-threading renders daily data updation and scanning / screening processes lightning fast.
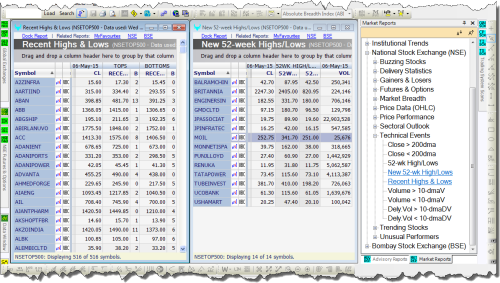
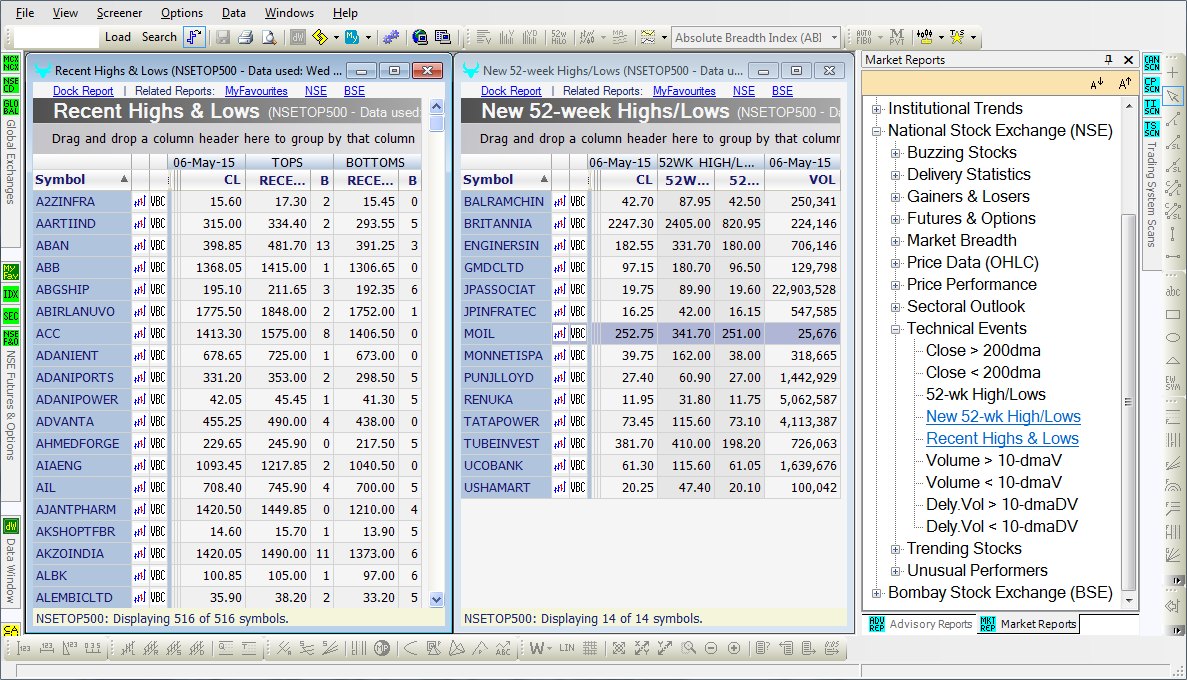
- This group of Market Reports includes the following ...
- ... 52-week Highs and Lows report, that displays the calendar High/ Low of symbols
- ... Recent Highs and Lows report, that displays the most recent High/ Low of symbols
- ... Close vis-a-vis its 200-day Moving Average report
- ... Volume vis-a-vis its 10-day Moving Average report
- ... Delivery Volume vis-a-vis its 10-day Moving Average report
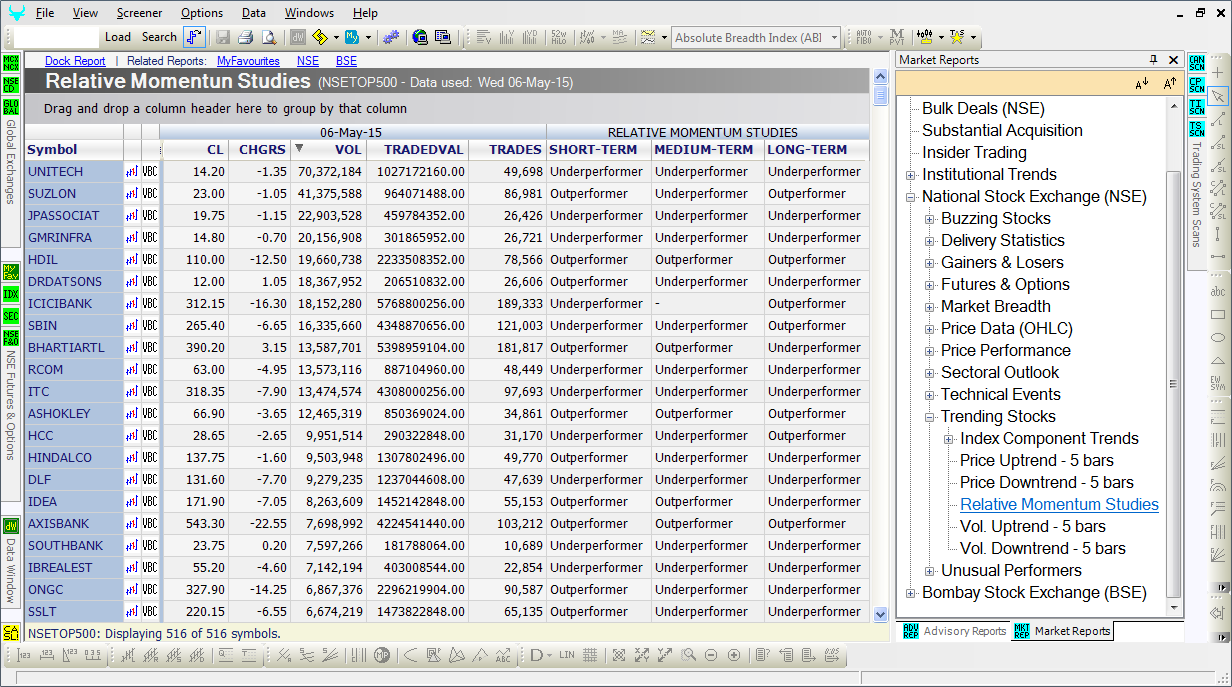
- This group of Market Reports includes the following ...
- ... Trends of symbols that make-up NSE market Indices and BSE market Indices
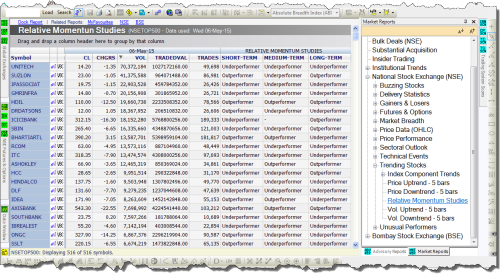
- ... Relative Momentum Studies report, wherein symbols showing momentum are segregated as Outperformers/ Underperformers, and then ranked relative to each other and market Indices, to further distill symbols that seem to offer a trading opportunity
- ... Symbols that are in a price Uptrend/ Downtrend currently
- ... Symbols whose trading Volumes are in an Uptrend/ Downtrend currently
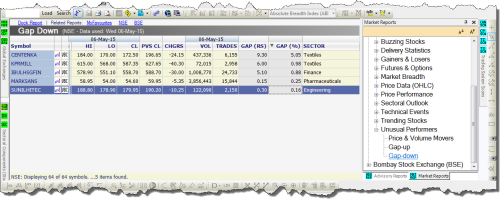
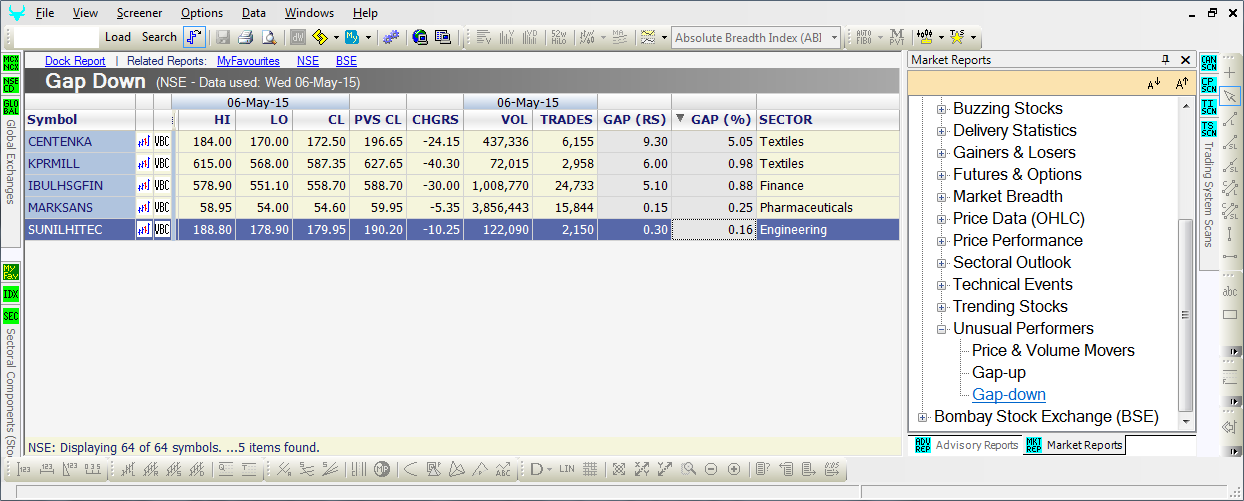
- This group of Market Reports includes the following ...
- ... Price & Volume Movers report that displays symbols whose latest prices have gained remarkably over the previous session, accompanied with a surge in the trading volume
- ... Gap-Up/ Gap-Down report, that displays symbols that have witnessed Gap-Up/ Gap-Down activity during the trading day
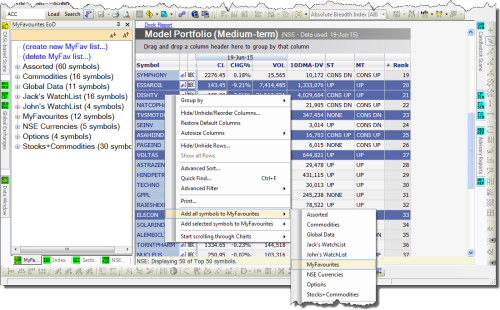
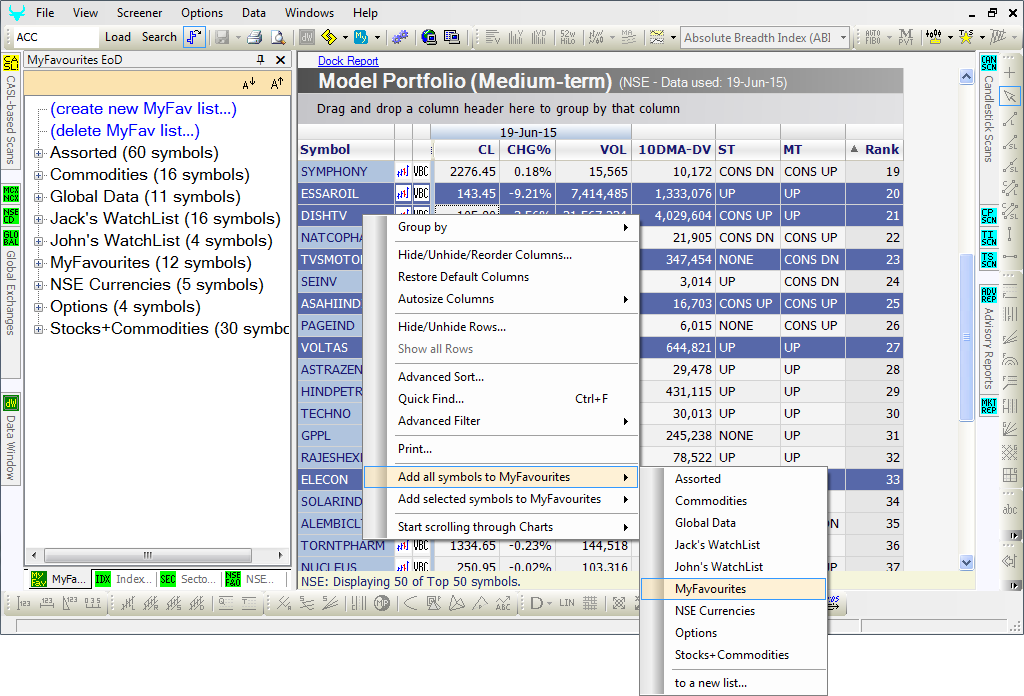
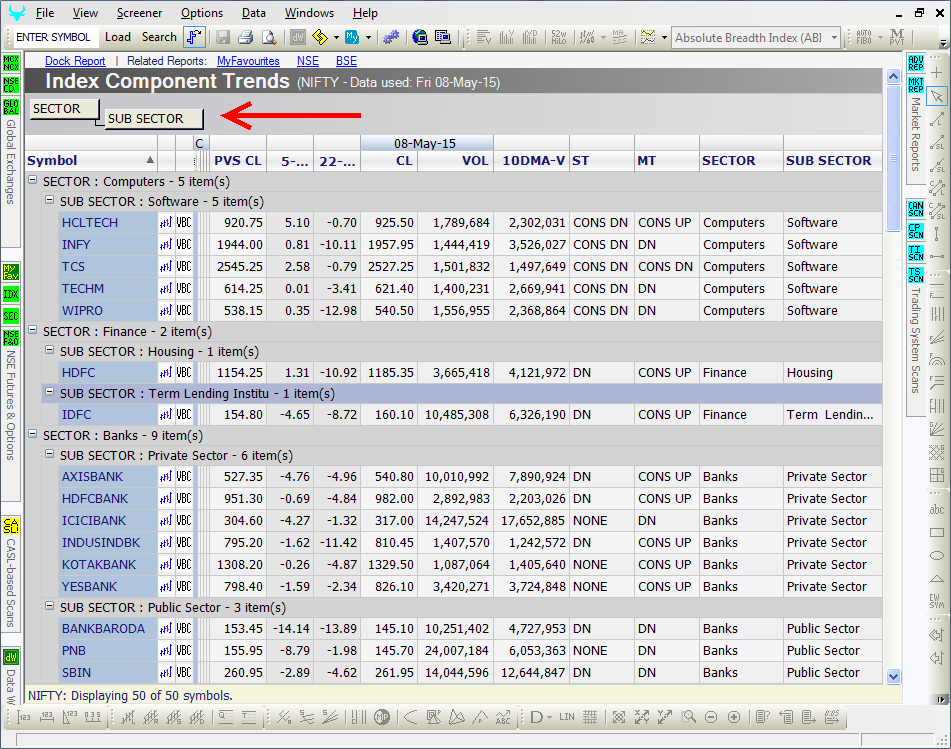
- All symbols, in all Market Reports, with a simple drag-and-drop functionality to a pre-defined area in the report, or via a right-click menu in the report, can be grouped Index-wise, or Sector-wise, or any Column-wise, for further scrutiny or analysis
- That is, symbols can be grouped Index-wise within a Sector, or can be grouped Sector-wise within an Index, or any Group-wise within another group — in short, the nesting of Groups in a report for further analysis is limitless
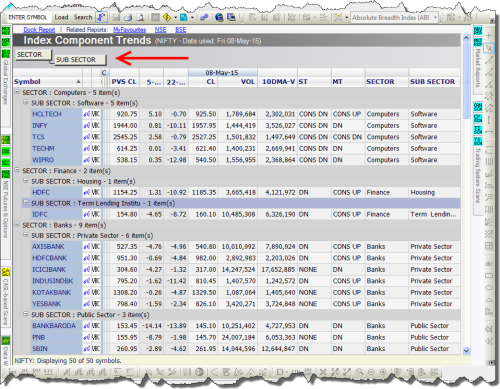
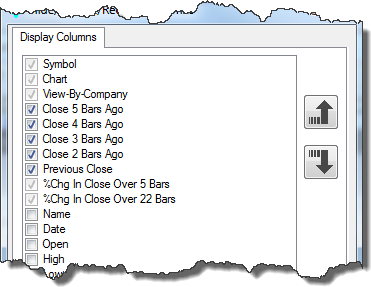
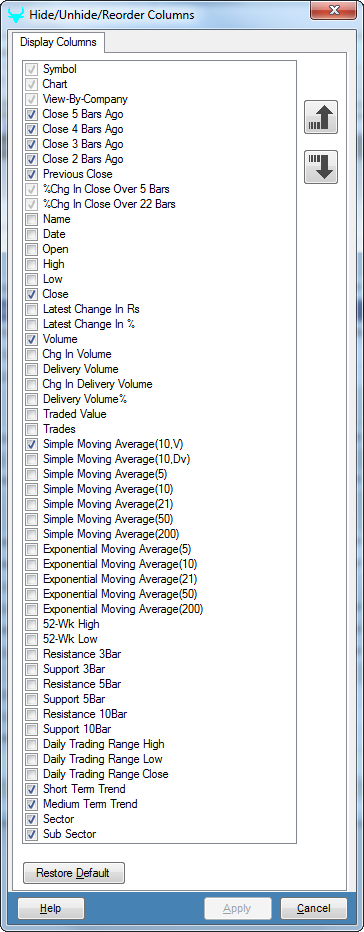
- All Market Reports come with a set of Technical Events (or parameters) in Columns, and symbols in Rows, and each of these reports also comes with Factory Default Settings that define the Technical Events that would be displayed in that report
- These Technical Events and symbol settings in each report can thus be fully customized (just like in a spreadsheet) and saved by the end-user to suit his/her reporting requirements and/or trading and investing needs
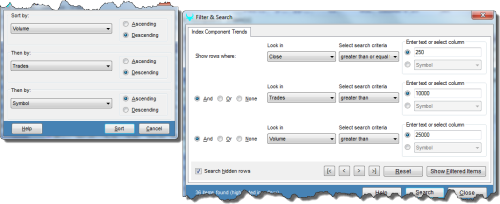
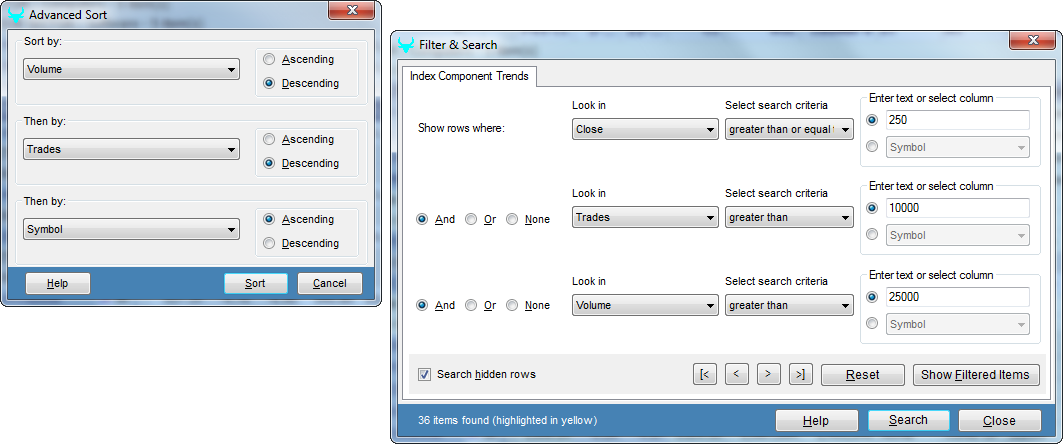
- Special controls such as Find/ Filtering/ Sorting are available in all Market Reports in ChartAlert® to search, filter and/or sort symbols by their Indices, Sectors, and/or Technical Events or parameters
- The Advanced Filter function lets you filter on the basis of up to three different parameters using an And/Or condition, and the Advanced Sort function lets you sort on the basis of up to three different parameters, very much like in a spreadsheet
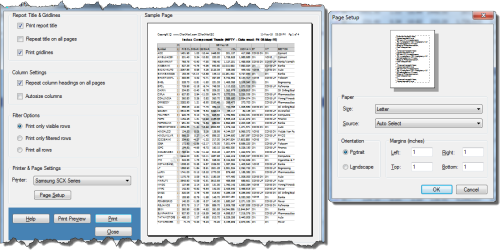
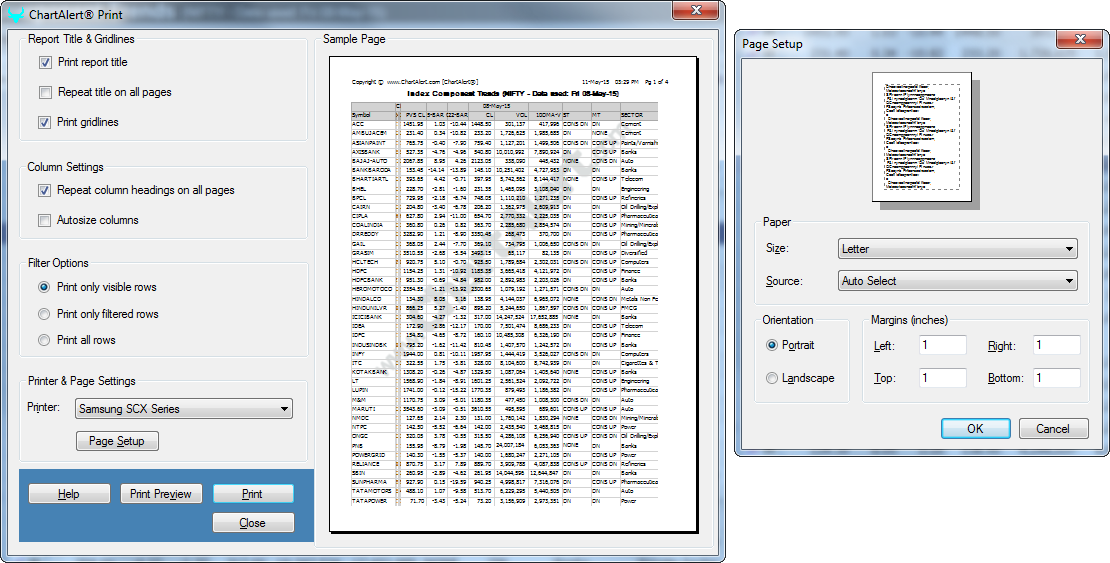
- The printing feature in ChartAlert® allows you to print grid format reports — in WYSIWYG format with all customized features intact — to a printer
- That is, any hidden rows or hidden columns in the report will be ignored at the time of printing
End-of-Day Data — Included with LITE Edition
The End-of-Day Data will also be included with RTE and PRO Editions in 2015
The data — issued in a ChartAlert® proprietary format — cannot be used with other charting softwares
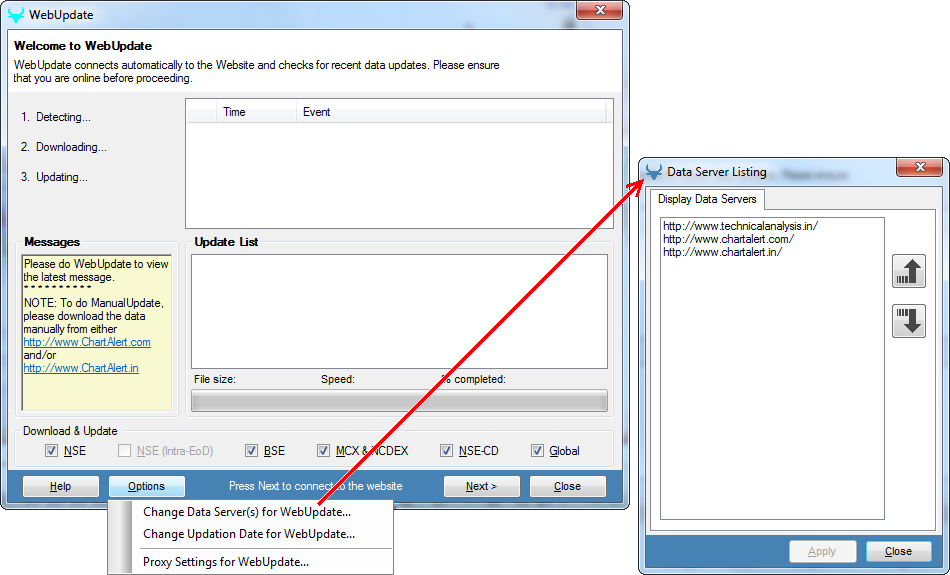
- ChartAlert® comes with an in-built data collection and updation feature — WebUpdate — that collects data for stocks, derivatives and commodities at End-of-Day from our website(s) after market trading hours
An internet connection is required to perform the WebUpdate process - The downloaded data is stored locally on your computer, and once updated, it can be used with the advanced Technical Analysis tools available in ChartAlert®
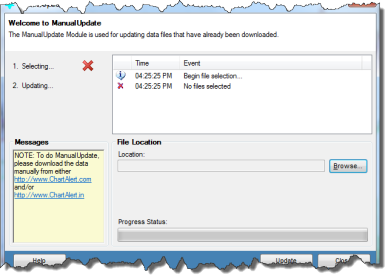
- ChartAlert® also comes with a manual data collection and updation option — Manual Update — wherein the end-user manually downloads End-of-Day data from our website(s) after market trading hours using a personal web browser
An internet connection is required to manually download the data via a browser from our website(s) - The downloaded data is stored locally on your computer, and once updated, it can be used with the advanced Technical Analysis tools available in ChartAlert®
- A ChartAlert® subscription includes access to clean-and-adjusted End-of-Day NSE data as listed below ...
- ... Cash or Spot Market — from the time of NSE's inception
- ... Futures Market — from the date of origin
- ... Index Options Market — from the date of origin
- The data — available for download everyday after market hours — is unadjusted for Mergers and Acquisitions, but is adjusted for Symbol Changes, Name Changes, Rights Issues, Bonus Issues, Stock Splits, Consolidation of Shares, etc
- A ChartAlert® subscription includes access to clean-and-adjusted End-of-Day BSE Cash or Spot Market data going back to the late-80s/ early-90s period
- The data — available for download everyday after market hours — is unadjusted for Mergers and Acquisitions, but is adjusted for Symbol Changes, Name Changes, Rights Issues, Bonus Issues, Stock Splits, Consolidation of Shares, etc
- A ChartAlert® subscription includes access to End-of-Day MCX Commodities data going back to the time of MCX's inception
- Since the MCX exchange trades till after 11PM IST, the End-of-Day data is made available for download the next day (usually) before market open
- A ChartAlert® subscription includes access to End-of-Day NCDEX Commodities data going back to the time of NCDEX's inception
- Since the NCDEX exchange trades till after 11PM IST, the End-of-Day data is made available for download the next day (usually) before market open
ChartAlert® Real-Time-Enabled Version — Coming in 2015
The RTE Version — when launched — will enable ChartAlert® to read, chart and scan real-time data streaming in from 3rd party data vendors in ASCII/ AmiBroker/ MetaStock formats.
- A ChartAlert® subscription includes access to select Global Equity or Stock Market Indices data
- The End-of-Day data is made available the next day
- The following Global Markets are covered ...
| Americas | Africa | Europe | South East Asia | Australia |
- A ChartAlert® subscription includes access to select Global Commodity Futures data
- The End-of-Day data is made available the next day
- The following Global Commodity Futures are covered ...
| Energy | Precious Metals | Industrial Metals | Agricultural Futures | Soft Agricultural Futures |
- A ChartAlert® subscription includes access to select Global Currency Pairs data
- The End-of-Day data is made available the next day
- The following Currencies — against the US$ — are covered ...
- The following Cross-Currencies are also covered ...
| AUD — Australian Dollar | CAD — Canadian Dollar | CHF — Swiss Franc |
| CNY — Chinese Yuan Renminbi | EUR — EURO | GBP — British Pound / Cable |
| HKD — Hong Kong Dollar | INR — Indian Rupee | JPY — Japanese Yen |
| KRW — South Korean Won | MYR — Malaysian Ringgit | NZD — New Zealand Dollar |
| RUB — Russian Ruble | SGD — Singapore Dollar | TWD — Taiwan New Dollar |
| EUR-AUD | EUR-CAD | EUR-GBP | EUR-HKD | EUR-INR | EUR-JPY |
| EUR-NZD | EUR-RUB | GBP-INR | GBP-JPY | INR-JPY |
- A ChartAlert® subscription includes access to the Baltic Dry or Baltic Freight Index data
- The End-of-Day data is made available the next day
- Issued by the Baltic Exchange, the Index provides an assessment of the price of moving the major raw materials over 20+ shipping routes on a timecharter basis
Premium Advisory Content — Coming in 2015
Premium Advisory Content will be available in 2015 as an add-on with PRO Edition
Premium Advisory Content will include: Medium-term & Long-term Strategies.
- FF is currently unavailable — it is expected in 2015
- This would be a medium- to long-term advisory report for those with average and/or above-average risk appetite
- Along with the Fundamental Spreadsheet in the PRO Edition, it will publish medium- to long-term ideal Buying and Selling areas, based on Technical Analysis and Fundamental Factors
- It will cover ~500 stocks, wherein symbols will be monitored for changes in Earnings Forecasts every quarter, and the ideal Entry and Exit areas will be updated accordingly
- EWA is currently unavailable — it is expected in 2015
- This would be a short- to medium-term advisory report for those with above-average risk appetite
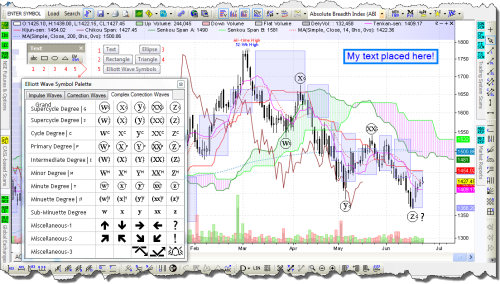
- Based on the Elliott Wave Principle, Fibonacci Price-Time Studies and Neely's Concepts, it would seek short-term 'Minor' and medium-term 'Intermediate' to 'Primary' degree swings — that is, trends that last between a few days and few weeks
- It will cover less than 50 large-cap stocks, and the analysis of the portfolio will be updated (in rotation) once-a-month or once-a-quarter
- EWM is currently unavailable — it is expected in 2015
- EWM would be a template designed by our analysts for the EWA portfolio of stocks
- EWM will allow you to see short-term, medium-term and long-term EW price labels, EW channels, and important EW supports & resistances labeled on the chart
Interactive Charting Module — Ships with Loads of Features ...
ChartAlert® ships with multiple Chart Types, several MAs, tons of Indicators, variety of Drawing tools, handful of Masks and Templates, assorted Trading Systems, and numerous other features.
... And more Features!
EoD Data — Data Window — Multiple Templates — Multiple WatchLists — Multiple Workspaces — Scroll through Charts — Sync multiple Charts — View multiple instances of a Chart — And more!
Coming in Future Versions
The following features will be available in the future versions: more EoD Charting Data; IEoD Charting Data; Real-time Charting Data; more Advisory and Charting features; and some Miscellaneous features.
- The RTE and PRO Editions will allow ChartAlert® to read Real-Time data formats issued by 3rd party data vendors in ASCII/ AmiBroker/ MetaStock formats
- Although currently unavailable, in the future, a ChartAlert® subscription will include access to clean and adjusted Intra-End-of-Day data in 1-min format covering ~500 NSE Cash Stocks, all NSE Futures, and all NSE Index Options — Intra-End-of-Day data is cimply Intraday data made available at the End-of-Day after market hours
- The IEoD data will be made available everyday after market hours, and although it will be unadjusted for mergers and acquisitions, t is expected to be adjusted for symbol changes, name changes, rights issues, bonus issues, stock splits, consolidation of shares, etc
- Although currently unavailable, in the future, a ChartAlert® subscription will include access to clean and adjusted End-of-Day BSE Futures & Options data
- The data will be made available everyday after market hours, and although it will be unadjusted for mergers and acquisitions, it will however be adjusted for symbol changes, name changes, rights issues, bonus issues, stock splits, consolidation of shares, etc
- Although currently unavailable, in the future, a ChartAlert® subscription will include access to Net Asset Value (NAV) prices of Mutual Fund schemes, and Assets Under Management (AUM) numbers of Mutual Fund houses
- This data will be made available at the End-of-Day after market hours, and is expected to include any adjustments where applicable
- The following features are expected in the future versions of ChartAlert® ...
| Gann Swing(s) and Gann Time Extension(s) | Gartley Pattern(s) and Pesavento Pattern(s) | ||
| ODDS Probability Cone | Price-Time Ratio | PyraPoint | Spiral Cycles |
- The following features are expected in the future versions of ChartAlert® ...
- ... AutoFibonacci — across grid reports
- ... Extraction of Technical Indicator values (n-stocks 1-day & 1-stock n-days)
- ... More Filters in Candlesticks scans and Trading System scans
ChartAlert® includes Stock Market Advisories / Stock Market Forecasts
Includes: Short-, medium- and long-term positional / swing trading strategies for full-time and/or part-time traders — daily, weekly and monthly trading ranges — model portfolios — and more.
- The following features are expected in the future versions of ChartAlert® — more Global Preferences options
- The following features are expected in the future versions of ChartAlert® — certain Technical Analysis patterns identified and overlaid, along with probable price targets, on the charts
- FRS — a part of the PRO Edition — is currently unavailable and is expected to be launched in 2015
- The FRS service — covering approx. 500 stocks — will include the following ...
| Annual Income Statements & Balance Sheets | Quarterly Results | Financial Ratios |
- FRS — a part of the PRO Edition — is currently unavailable and is expected to be launched in 2015
- When issued, FRS is expected to ship with P/E Chart Overlays for ~500 stocks
- The following F&O features — a part of the PRO Edition — are expected in the future versions of ChartAlert® ...
- ... Black-Scholes model fully implemented for European/ Asian/ American/ Binary Options
- ... Evaluation of Greeks, that is, Delta/ Gamma/ Rho/ Theta/ Vega for Options on Indices and/or Stocks
- ... Volatility Estimates, and Implied Volatility, for dividend and/or non-dividend paying Stocks
- ... Put/Call parity relations, pay-off functions at expiry for European/ Asian/ American/ Binary Options
- ... Trading Strategies — Spread Option (Bull, Bear & Butterfly), and Combination Option (Straddles & Strangles)
- ... Pricing of Futures contracts on Indices, Stocks, etc
- ... Portfolio hedging using Index Futures, Optimal Hedge Ratio, Futures A/c Management, Interest Calculations, etc
- ... Risk Management functionality incl. Delta Limit Monitoring, Scenario Analysis, etc
- Printing Reports/ Charts to PDFs
- Export select Grid Reports to Microsoft® Excel
- Export Charts to PNG Format
Flash-based Demos/ Videos can be accessed from here Gallery of Screenshots can be accessed from here
Email Response in 2 Business Days
If you are unable to find answers to your questions, and have further queries regarding ChartAlert®, please send us an email.
Email Response in 1 Business Day
We are committed to our Subscribers — if you ever encounter a problem with our services, please email us or call us.